
CONTENTS
- 120 Interesting Facts and Stats About the Internet Use in 2021
- Historical Facts
- General Facts About the Internet Use in 2021
- Internet Coverage and Penetration Stats
- Internet Speed Stats
- Network Equipment Stats
- Search Engines, Browsers, and Popular Searches in 2021
- Website and Domain Stats
- Social Media Stats – Facebook, Twitter, Instagram, YouTube, TikTok
- Mobile Internet Stats
- Video and Music Streaming Stats
- eCommerce Stats
- Online Gaming Stats
- Conclusion
120 Interesting Facts and Stats About the Internet Use in 2021
We often tend to take the internet, Wi-Fi, and all the other technology that surrounds us for granted. We rarely think about how it all started and where it’s going. Do you know who invented the web? Or how big the internet is today? Did you know that more than 34% of the world still doesn’t have internet access? Can you guess how much money is made on the internet every day?
Our article is here to help you grasp the size, significance, and impact the internet has on our lives. Over the past month, we’ve gathered a huge number of fascinating facts and stats about internet use in 2021 and arranged them into 12 categories. Everything you need to know about the internet is right below.

Historical Facts
It doesn’t hurt to know a few things about how it all started before diving deeper into the overwhelming world of the internet. Below, we have listed some of the most important turning points in internet history.
- How Old is the Internet?
As of January 1st, 2022, the Internet is 39 years old. Its predecessor ARPANET was created in November 1969, for military purposes. When ARPANET adopted TCP/IP protocol in January 1983, the modern internet was born. At the same time, ARPANET was divided into two separate networks (military and civilian).
- The Birth of the World Wide Web
World Wide Web (aka WWW or Web) was born on March 12, 1989. Its creator was Tim Berners-Lee (TimBL), a former CERN employee and a computing legend. Tim is also known as the ‘’Father of the Web’’.
While often used interchangeably, the terms World Wide Web and Internet are not the same things. Internet is the actual global network of computers that can communicate with each other and exchange information. The web is a way of accessing the Internet. Internet is like a global network of highways and roads connecting every single place. The World Wide Web are all the sceneries that you see while traveling those roads. WWW is not the only way of accessing the internet. Other popular systems used for internet access are email and internet telephony.

Google Doodle dedicated to the 30th anniversary of the World Wide Web
- The First Website and First Webpage
The first website ever was created on August 6, 1991. Its creator was Tim Berners-Lee, the same guy who invented the World Wide Web. The first webpage in the world contained information about the WWW project. The website was hosted on a NeXT computer at CERN.

The original NeXT computer used to design and host the first website in the world. The sticker on the housing says: ”This machine is a server. DO NOT POWER IT DOWN!!” (source – Google Arts & Culture)
- The First Image Published on the Web
The first image uploaded to the Web was an image of four CERN female employees. All four were members of a parody band called Les Horribles Cernettes. The image was uploaded in 1992.
The first image published on the World Wide Web

Image Source : Wix
- Surfing the Internet
The term “surfing the Internet” or “surfing the Net” was invented by librarian Jane Armour Polly. In March 1992 she published an article named “Surfing the Internet”.
Jane Armour Polly was inducted into the Internet Hall of Fame in 2019
- The First Email
Email is much older than the World Wide Web. It’s even older than the modern internet. The first email was sent over ARPANET. Ray Tomlinson, a computer engineer, sent an email to himself in 1971. It was a test message. He sent it from one computer to the computer sitting right next to it, but the message traveled using ARPANET. It all happened in Cambridge, Massachusetts. Ray was also the guy who picked the @ sign for email addresses.
Raymond Tomlinson – The Father of the Email
- The First Search Engine
I think we all know what’s the most popular search engine today, but you probably don’t know that the first search engine in the world was launched in 1990, eight years before Google. The name of the search engine was Archie. The first widely known and used search engine was the WebCrawler. It was launched in 1994, 4 years before Google. WebCrawler was the first crawler-based search engine that allowed internet users to search for any word on any website – that is a standard for all search engines today. WebCrawler still exists – it combines top results from Google Search and Yahoo Search.
- The Birth of Social Media
None of today’s most popular social media services was the first. It all started in December 1995 with a website called classmates.com. The website was basically a list of school affiliations that allowed people to get in touch with former classmates. Classmates.com was followed by a Swedish social networking website called LunarStorm (1996). After that, ICQ was introduced in 1996, SixDegrees.com in 1997, and AOL Instant Messenger in 1997. According to some sources, Six Degrees is still considered to be the first social media network.
A few other social networking websites existed before Facebook, Instagram, and TikTok. Friendster, for example, was launched in 2002, HI5 was launched in 2003, LinkedIn and Skype were both launched in 2003, a few months before Facebook. Once popular social networking website called Myspace was also launched in 2003. Facebook was born on February 4, 2004. It was followed by numerous other social networking websites like Flickr (2004), Reddit (2005), Twitter (2006), Tumblr (2007), Pinterest (2010), Instagram (2010), Quora (2010), Snapchat (2010), Google+ (2011), Twitch (2011), Tinder (2012), Vine (2013), Discord (2015), TikTok (2017), and many others.
- The First eCommerce Website
The first eCommerce service in the world was Boston Computer Exchange. It was launched in 1982, long before Amazon, e-bay, and many others. People used this website to sell their old computers. Boston Computer Exchange used ARPANET at first. Amazon, which is today the synonym for eCommerce was launched in 1994. Back then, Amazon was just an online bookstore.
- Was There Streaming Before YouTube and Netflix?
The first live video stream happened in 1993. It was a stream featuring a garage band called Severe Tire Damage. The first live audio stream happened in September 1995. ESPN SportsZone streamed a baseball game between the Mariners and Yankees.
In 1997, the predecessor of YouTube called ShareYourWorld.com was launched. It allowed users to upload and share video files. YouTube was launched 7 years after.
The first Video-On-Demand service was launched in Hong Kong in 1998, but it was shut down four years later. Netflix was launched in 2007, 5 years after the “death” of Honk Kong Telecom’s iTV. Amazon Video (aka Amazon Prime Video) was launched a few months before Netflix (September 2006).
Hong Kong iTV Commercial
Rhapsody (aka Napster) was the first subscription-based music streaming service. It was launched in 2001.
- Online Gaming – The Beginnings
Maze War was the first peer-to-peer video game. It was created in NASA’s Ames Research Center in 1973. After the first version, Greg Thompson, one of the creators of Maze War, wrote the server program which allowed up to 8 players to play against each other. This makes Maze War the first client-server video game. Maze War used ARPANET protocols.
Maze War (1974)
The first game that used TCP/IP protocol was SGI Dogfight. It was released in 1986. At first. playing the game across the internet was not possible – it was limited to a single network. IP Multicast option was added in 1989, which made it playable across the internet.

SGI Dogfight – the first video game that used TCP/IP protocol
Image Source – Wikipedia
After the introduction of IP Multicast in 1989, many game creators have added this ability to their games and created new online gaming services. SEGA, for example, created its Meganet in 1990.
- The First Computer Virus
The first PC virus was developed in 1984. Its creator was Fred Cohen. He was also the man who invented the term computer virus.
- The First Modems
The first commercially available modem was Bell 103. It was introduced in 1962 by AT&T. As you can assume, the first modem was not used for internet access. Not even ARPANET existed back then. The modem used phone lines to transmit digital data at speeds up to 300 bits per second.

Bell 103 – The First Commercially available modem
The first non-Bell modem was Hayes S-100. It was released in 1977. This was also the first modem made for a personal computer. The first smart modem was also created by the Hayes Associates and was released in 1981. Using the RS-232 serial port, any computer connected to the modem was able to control the functions of the modem. During the 80s and 90s, Hayes was a premium brand. It held 50% of the modem market.

Hayes Smart Modem 1200
Image Source – Amazon
The first 56kbps modem was developed by Brent Townshend. It was the year 1996. Most 56kbps modems were dial-up modems.
The world’s first DSL modem was made by Dr. John Cioffi, owner and founder of Amati Communications. The first modem was called Amati Prelude and was introduced in 1992.

Amati Prelude – The World’s First ADSL Modem
Image Source – researchgate.net
The first cable modem was made in 1990 by Rouzbeh Yassini, the founder of LANcity. LANcity went through a series of acquisitions and joint ventures until it finally became part of a well-known cable modem manufacturer – ARRIS.
LANcity Cable Modem
- The First Router
Before the invention of wireless communication standards, there was the so-called WaveLAN. This wireless standard was invented by NCR Systems Engineering and AT&T in 1991 and was designed for cashier systems. The max data rate for WaveLAN products was 2Mbps.
The first wireless communication standard 802.11 was introduced in 1997 and then updated to 802.11b in 1999. One of the first manufacturers to implement 802.11b was Apple. Apple’s AirPort product line was first introduced in July 1999. One of the AirPort products was the AirPort base station – a wireless switch and a router. This could easily be one of the first Wi-Fi routers compliant with the 802.11b protocol.
AirPort Base Station Commercial (1999)
- The First Cyberattack
The first major cyberattack happened in 1988 and it wasn’t intentional. At the time, Robert Morris was a Cornell graduate student. He was trying to assess the size of the internet. For that purpose, he designed a program (today known as Morris worm) that was supposed to crawl the web and install itself on users’ computers. However, the experiment went wrong. His program multiplied itself uncontrollably until the infected computers crashed. That was the first recorded DDoS attack. It damaged 6,000 computers. Back then, that was almost 10% of all devices connected to the internet.
General Facts About the Internet Use in 2021
Let’s start with the basics. The following stats will answer the most common questions about internet use in 2021. You will find out how many people have internet access, what languages are the most used on the internet, and what regions/countries had the highest/lowest number of internet users in 2021. Oh, and you will learn a thing or two about the age distribution of internet users.
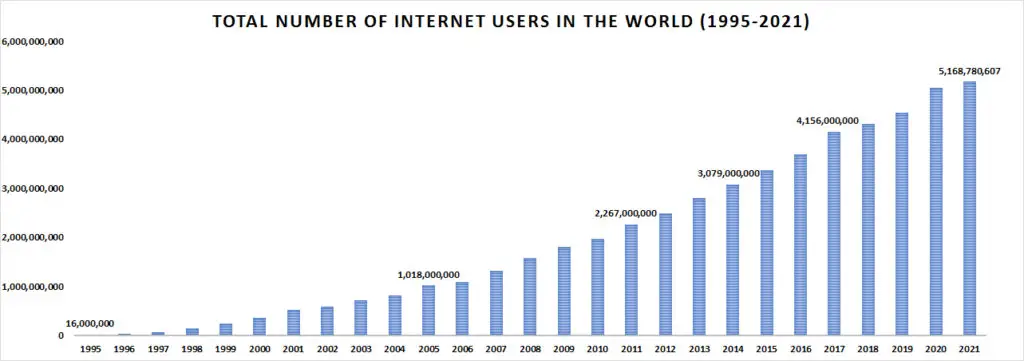
- The Number of Internet Users in the World Exceeded 5 Billion in 2020
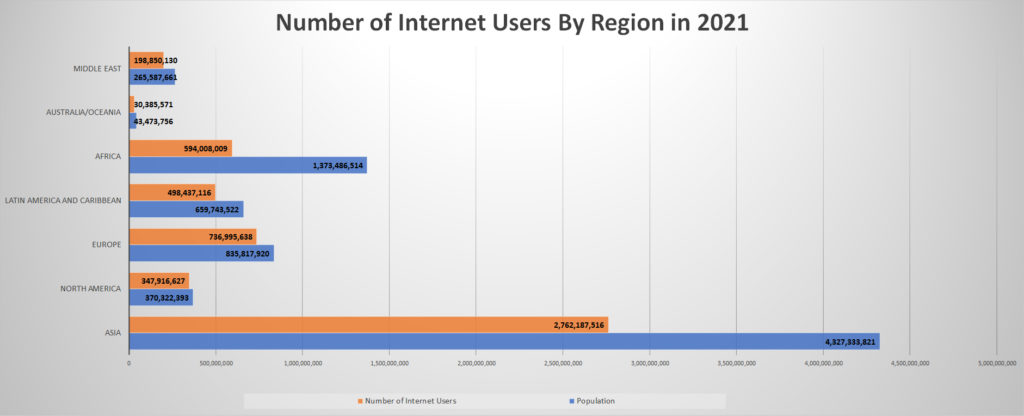
There are 7.8 billion people on Earth. As of March 2021, the total number of internet users in 2021 is 5,168,780,607. More than 2.76 billion users are from Asia. Africa has 1.37 billion users. Europe is the third with 835 million users. North America (the US and Canada) has 370 million internet users.
Source – Internet World Stats
The number of internet users has been increasing exponentially over the past two decades. In 1995, there were only 16 million internet users. In 10 years, we have reached 1 billion. Over the next ten years, the total number of internet users in the world reached 5 billion.
Sources – IDC, Internet World Stats, Nua Ltd.
- China and India Have the Highest Number of Internet Users in the World, while North Korea has the Lowest Number of Internet Users
As of June 2021, China has 989 million internet users. India has 755 million users. The USA is the third with 313 million internet users. Other countries with more than 100 million internet users are Indonesia (212), Brazil (149), Nigeria (154), Japan (118), Bangladesh (117), Russia (116), and Pakistan (100). The estimated population of North Korea is 25 million, while the number of internet users in this country is only 20,000.
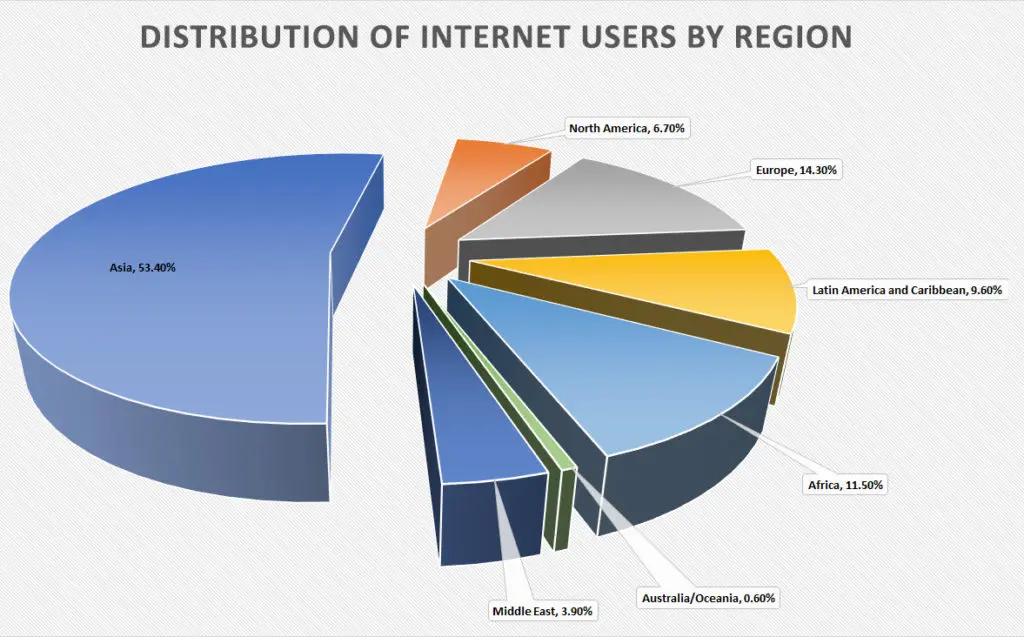
- 53.4% Of All the Internet Users in the World Are from Asia
More than half of all the internet users in the world are from Asia, which is not a surprise since the highest population density is also in Asia – 54.9% of the entire world population lives in Asia.
Source – Internet World Stats
- English is the Most Frequently Spoken Language Among Internet Users
According to Internet World Stats and Statista, English is the most commonly used language on the Internet. 25.9% of all internet users in the world speak English. Chinese is the second with 19.4% and Spanish is third with 7.9%. Other top-ten languages on the internet are Arabic, Portuguese, Indonesian/Malaysian, French, Japanese, Russian, and German. 23.2% of internet users in the world speak some other language.
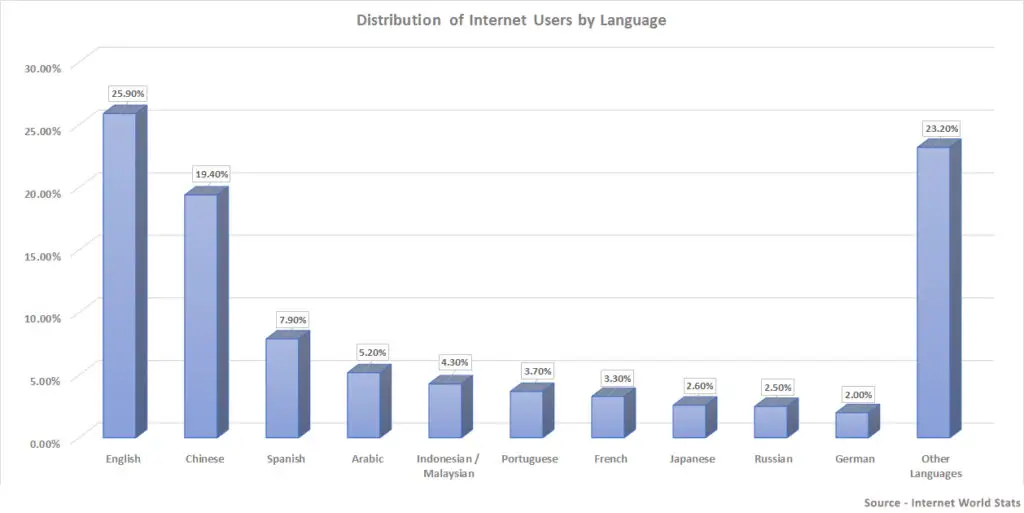
Source – Internet World Stats, Statista
Why these languages? The answer partially lies in the colonial history of countries like the UK, Spain, Portugal, France, Russia, and Germany. China, Japan, and Indonesia are simply large and (more importantly) have extremely high population density.
- More than 63% of All the Content on the Web is in English
In 1999, 72% of all the content on the internet was in English. According to Web Technology Surveys, of the top 10 million websites on the internet, 63.6% are in English. Russian is the second with 6.9%, and Turkish is the third with 3.9%.
Other notable languages when it comes to web content are Spanish (3.6%), Persian (3.5%), French (2.5%), German (2%), Japanese (1.9%), Vietnamese (1.9%), Chinese (1.3%), Arabic (1.3%), Indonesian (0.8%), and Portuguese (0.7%).
The most confusing thing about this survey is the fact that only 1.3% of all the content on the top 10 million websites is in Chinese even though Chinese is the second most dominant language among internet users (right after English).
You should, probably take this survey with a pinch of salt because it analyzed only the top 10 million websites, which is just 5% of all the websites in the world.
- Only 7% of all Internet Users in the World are Older than 65
According to Statista survey from 2019, 83% of all internet users are younger than 55. 18% of adult internet users are 18-24-year-old. Adults between 25 and 34 are the largest group of internet users (32%).
- 99% of Adults Between 18 and 29 in the US Are Internet Users
According to Statista Survey from 2021, 99% of 18-29-year-old adults living in the US are internet users. 98% of US citizens aged between 30 and 49 and 96% aged between 50 and 65 use the internet. Only 75% of people older than 65 are internet users.
Source – Statista
- Internet Users Spend 6h 58min Surfing the Internet Every Day
According to Data Reportal (and based on GWI Q2 2021 figures), internet users aged between 16 and 64 spend almost 7 hours every day on various internet-related activities. The average time spent on broadcasts and streaming is 3h 21min. Other popular online activities are social media (2h 27min), music streaming services (1h 35min), podcasts (57min), and gaming (1h 13min).
Source – Data Reportal
- The Number of Email Users Exceeded 4 Billion in 2020
The number of email users in 2020 was 4.037 billion. The number of email users increased by 3.9% since 2019. The projection shows that the number of email users by the end of 2025 will be 4.59 billion.
Source – Radicati, Statista
- The Number of Email Accounts Is Growing Faster than the Number of Email Users
The number of Accounts per user in 2018 was 1.75. It is estimated that the number of email accounts per user will reach 1.86 by the end of 2022.
Source – Radicati
Internet Coverage and Penetration Stats
The number of internet users in 2021 seems impressive and it tells us how fast the internet is spreading all over the world. However, it also tells us how many people still don’t have internet or are not internet users. In this section, we will discuss internet penetration stats in different regions and countries. We will also analyze internet coverage and penetration in the US.
- The region with the Highest Internet Penetration is North America. Africa Has the Lowest Internet Penetration
93.9% of the population of North America uses the internet. Internet penetration in Africa is, by far, the lowest – 43.2%. 56.8% of Africa’s population don’t use the internet or don’t even have internet access. Europe is right behind North America with 88.2%. The third is Latin America and the Caribbean with 75.6%. Even though it has the highest number of internet users, the internet penetration rate in Asia is just 63.8%. 34.4% of the world population doesn’t use the internet.
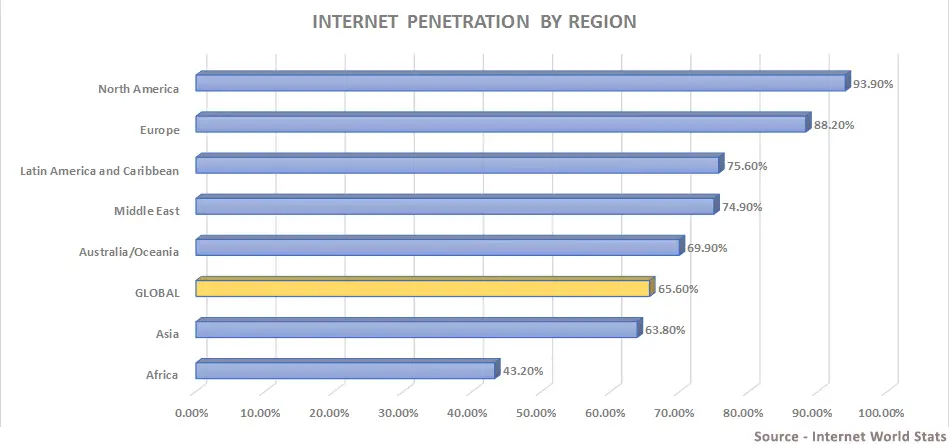
Source – Internet World Stats
- Since 2000 the Number of Internet Users in the World Increased By 1,331%
Over the past 21 years (2000-2021), the number of internet users in Africa increased by 13,058%. That’s the highest growth of all the world regions, and it’s still not enough to reach 50% penetration. Other regions have also experienced huge growth in the number of internet users over the past two decades. Besides Africa, regions with the highest internet growth were the Middle East (5,953%), Latin America (2,658%), Asia (2,316%), and Europe (601%).
North America had the lowest 20-year growth, but that’s just because North America had a head start over the other regions. Back in 2000, there were only 361 million internet users in the world, and a large portion of those 361 million users was based in North America. Even in 2000, 52% of adults in the US were already using the internet.
Source – Internet World Stats, Statista, Census.gov
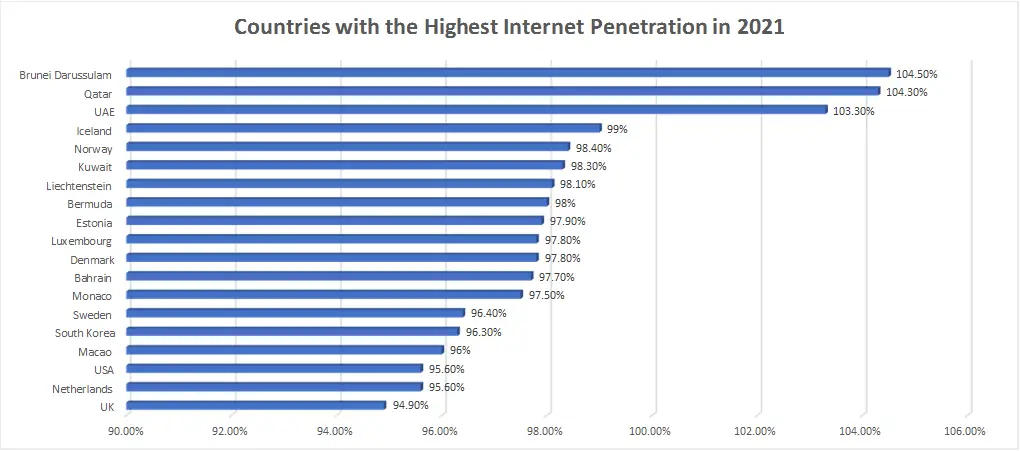
- Countries with the Highest Internet Penetration Rate
One of the great advantages of small, especially small and reach countries is that they look very good when you look at their internet stats. It’s much easier to achieve 100% internet penetration when a country is small and reach. Below, you can see a list of countries that have reached at least 94% internet penetration and most of them are small and/or wealthy.
Americas: Bermuda (98%), Falkland Islands (99.2%), St. Barthélemy (100.8%), United States (95.6 %)
Asia: Brunei Darussalam (104.5%), Japan (94.5%), South Korea (96.3%), Macao (96%),
Europe: Andorra (94.5%), Denmark (97.8%), Estonia (97.9%), Faroe Islands (97.6%), Iceland (99%), Liechtenstein (98.1%), Luxembourg (97.8%), Monaco (97.5%), Netherlands (95.6%), Norway (98.4%), Sweden (96.4%), UK (94.9%)
Middle East: Bahrain (97.7%), Kuwait (98.3%), Qatar (104.3%), UAE (103.3%)
You have probably noticed that some countries (Qatar, UAE, St. Barthélemy, Brunei) have internet penetration higher than 100%. Don’t get confused by these percentages. They just mean that the number of registered users in those countries is higher than the number of citizens. This doesn’t necessarily mean that every single citizen in those countries uses the internet. These small and wealthy countries have a huge number of expatriates and most of them (if not all) are internet users. They are also part of this statistic even though they are not citizens.
Africa and Australia with Oceania are the only regions without countries with internet penetration higher than 95%. States with the highest internet penetration in Oceania are Australia (84.2%), Guam (87.8 %), New Caledonia (80.6%), New Zealand (89.4%), and Niue (91.7%).
States with the highest internet penetration in Africa are Kenya (85.2%), Libya (84.2%), Mauritius (72.2%), Nigeria (73%), and Seychelles (72.1%).
Source – Internet World Stats, Statista
- 14.4 Million People in the US Don’t Have Access to Broadband Internet
A Broadband internet connection, as defined by the Federal Communications Commission, is an internet connection that can deliver download speed of at least 25 Mbps and upload speeds of at least 3 Mbps.
While the US is one of the top states when it comes to internet penetration, there are still millions of people living in the US without broadband internet access. 14.4 million, to be precise. They either have to use the internet at lower speeds (10 Mbps or even 5 Mbps) or don’t have internet access at all.
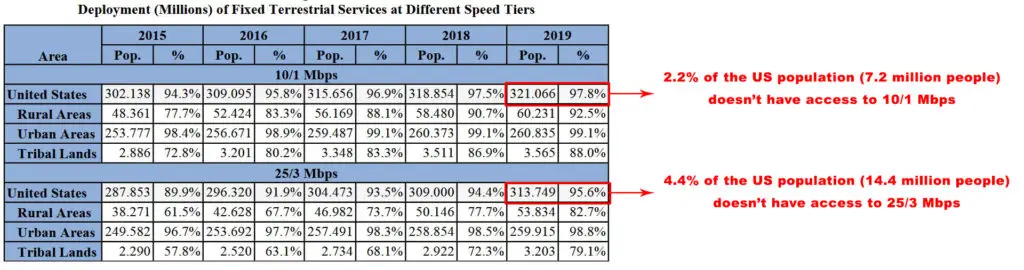
Source – Federal Communications Commission

Internet Speed Stats
Now that we know how many people are internet users, let’s see the speeds they get. It’s not the same if you are using the internet at 10 Mbps and 100 Mbps. Read the following stats and find out what countries have the lowest and highest internet speeds in the world.
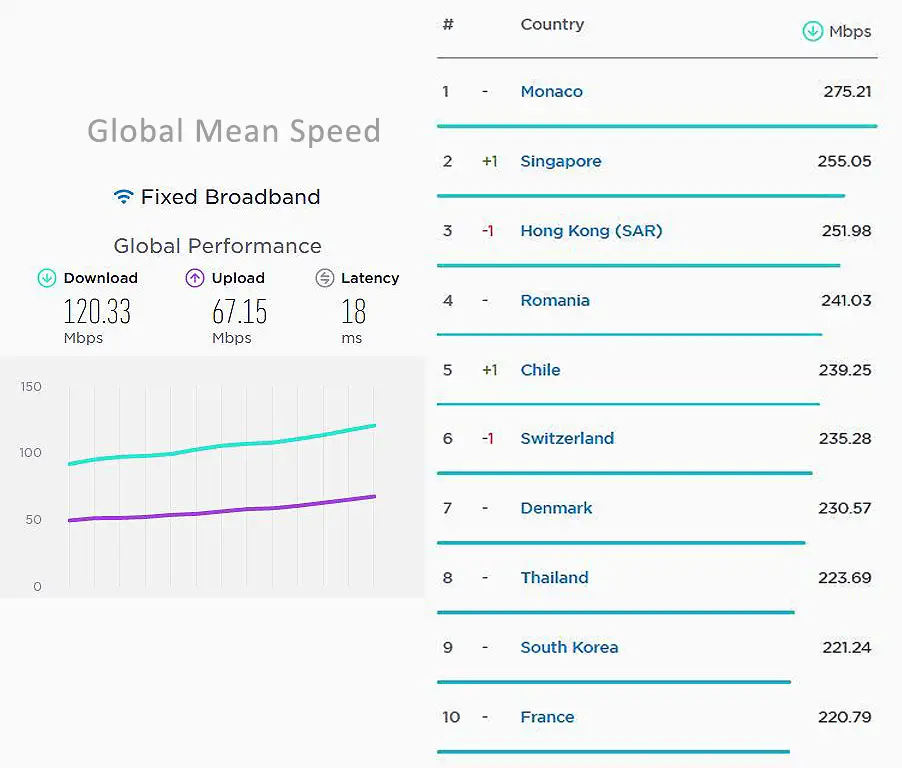
- Global Mean Download Speed is 120 Mbps
As of November 2021, the global average download speed is 120 Mbps, while the upload is 67.15 Mbps. A year before, in November 2020, the average download/upload speeds were 91/49 Mbps. Monaco, Singapore, and Hong Kong lead the race with average download speeds of 275 Mbps, 255 Mbps, and 251 Mbps respectively.
Source – Speedtest.net
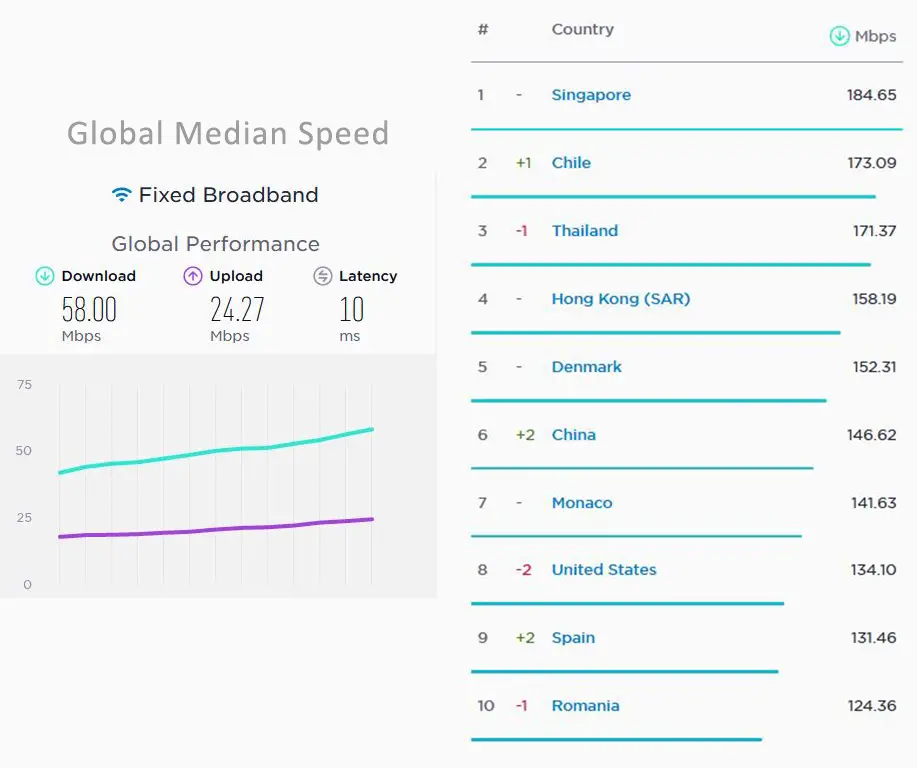
- Global Median Download Speed is 58 Mbps
As of November 2021, the global median download speed is 58 Mbps, while the upload speed is 24 Mbps. A year before, in November 2020, the median download/upload speeds were 41/17 Mbps. Countries with the highest median download speeds are Singapore (184 Mbps), Chile (173 Mbps), and Thailand (171 Mbps).
Source – speedtest.net
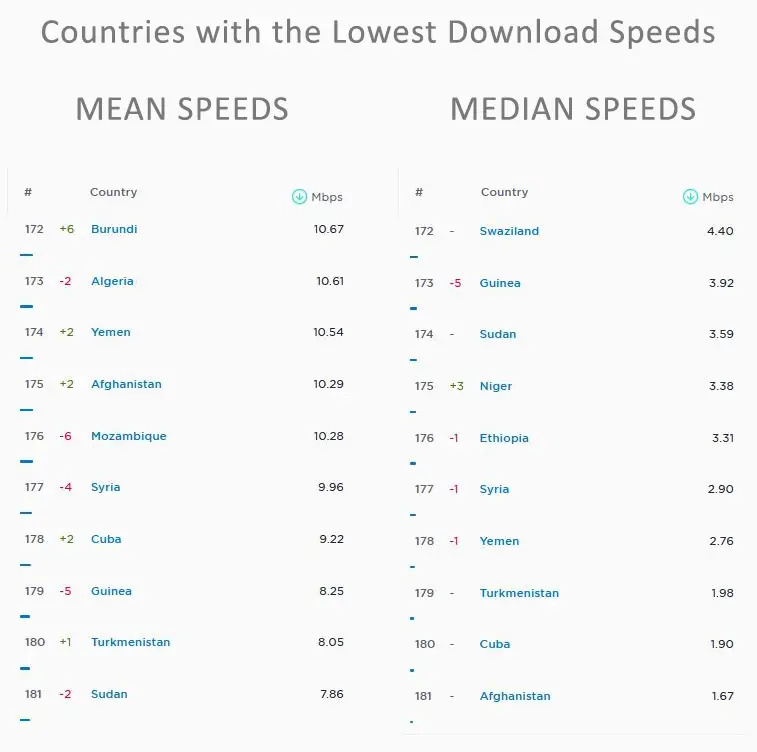
- Countries with the Lowest Download Speeds in the World
While it all looks so nice and lovely when you look at those high download speeds in Singapore Hong Kong, the US, and all over Europe, you should also be aware that that are still countries where internet access is considered a luxury. Hell, there’re countries where access to drinking water is a luxury.
In 40 countries, the median download speed is lower than 10 Mbps. Each of the 10 countries with the lowest median download speeds in the world has a median download speed lower than 5 Mbps. In five countries, the median download speed is lower than 3 Mbps.
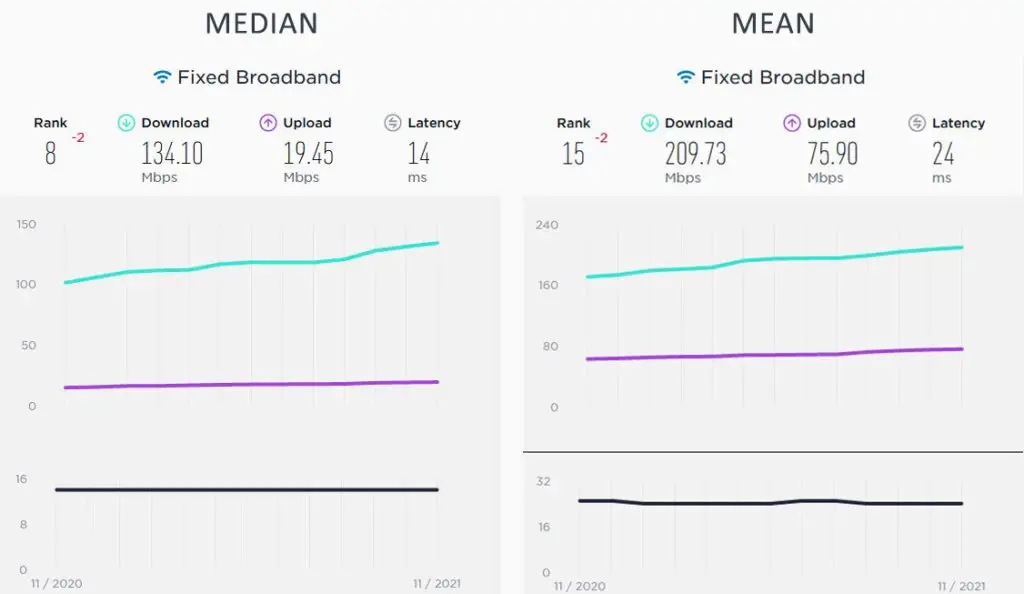
- The US Has the 8th Highest Median and 12th Highest Average Download Speed in the World
The median download speed in the US, as of November 2021, is 134.10 Mbps. The average (mean) download speed in the US is 209 Mbps. Just a year before, the average download speed was 170 Mbps, while the average median speed was 101 Mbps.
Source – speedtest.net
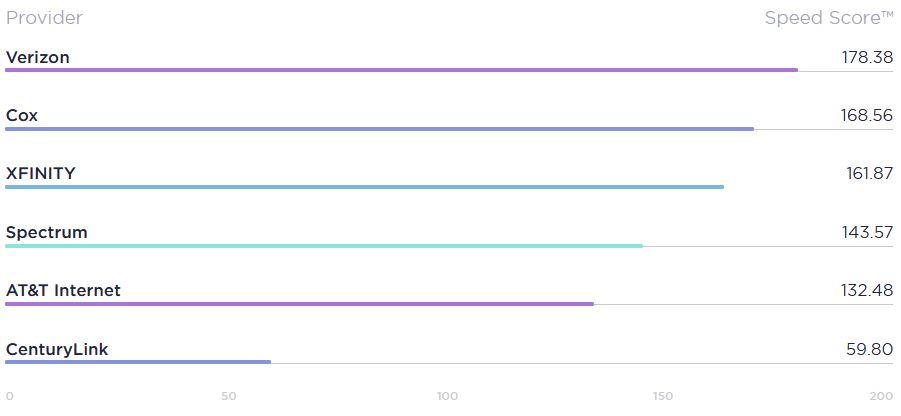
- Best Internet Providers in the US
Verizon, Cox, and Xfinity deliver the highest download speeds of all internet providers in the US. Their Speed Scores are 178.38, 166.56, and 161.87 respectively. CenturyLink has the lowest Speed Score. Speed Score was created by speedtest.net and represents a combined measure of ISP’s download and upload speed.
Source – speedtest.net
The same three internet providers also deliver the lowest median latencies. Generally speaking, most major ISPs in the US deliver acceptable latency values (under 20ms).
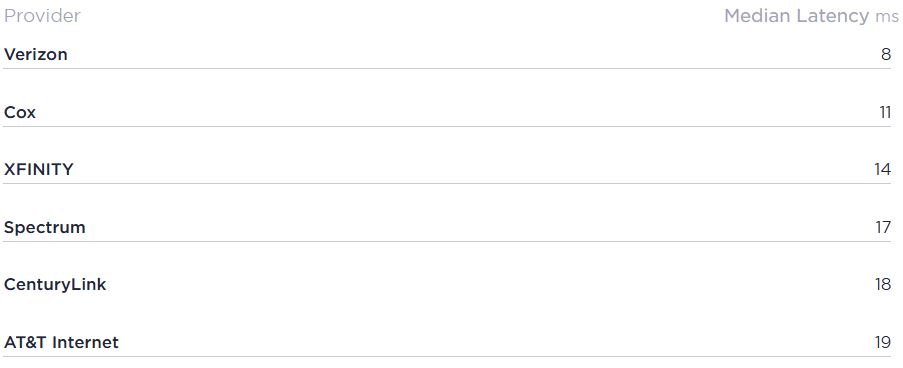
Source – speedtest.net
- Of all ISPs in the US, Xfinity, Spectrum, and Verizon Deliver the Most Consistent Speeds
Xfinity, Spectrum, and Verizon deliver the most consistent performance. Cox and AT&T are also fairly consistent when it comes to internet speeds. CenturyLink is far from the top five.
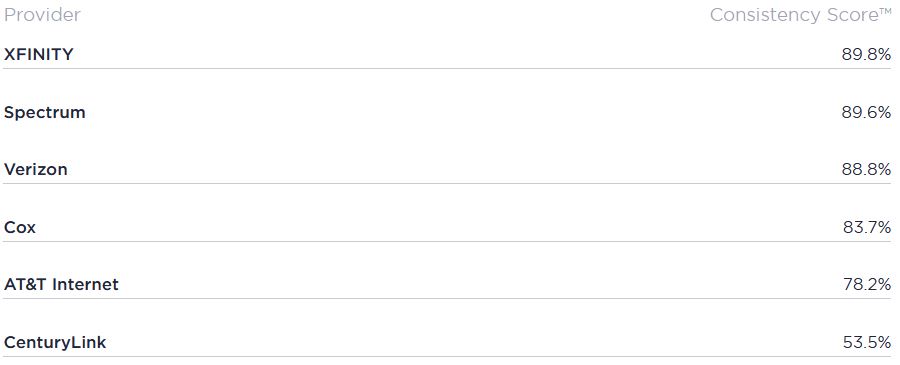
Source – speedtest.net
- The US States with The Highest and Lowest Median Download Speeds
The top five states with the highest median speeds in the US are New Jersey (158/36 Mbps), New York (147/25 Mbps), California (142/16 Mbps), Florida (141/20 Mbps), and Texas (140/21 Mbps).
States with the lowest median speeds in the US are Wyoming (51/10 Mbps), Montana (52/11 Mbps), Alaska (56/12 Mbps), Vermont (68/11 Mbps), and New Mexico (69/10 Mbps).
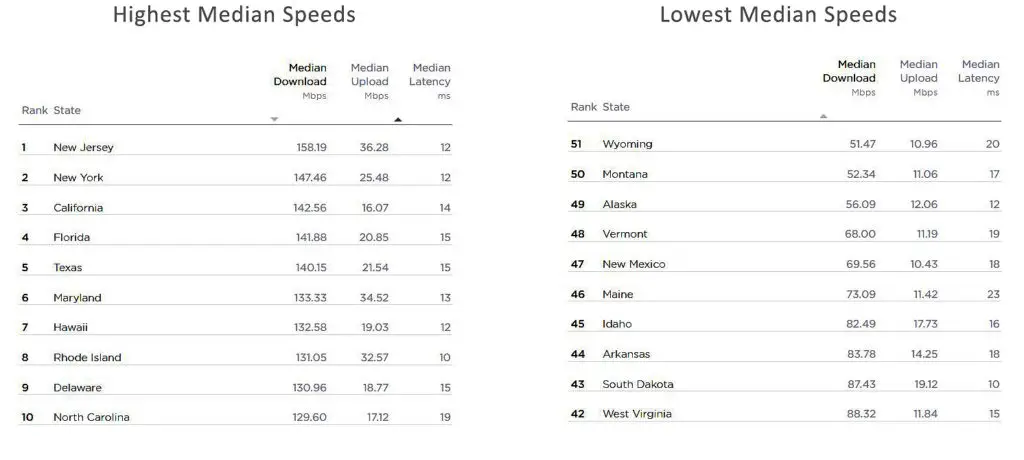
Source – speedtest.net
- US Cities with the Highest Median Download Speeds
The top-five US Cities with the highest median download/upload speeds are Austin, TX (196/23 Mbps), San Antonio, TX (192/22), Charlotte, NC (192/23 Mbps), Raleigh, NC (192/23 Mbps), and Jersey City, NJ (186/89 Mbps).

Source – speedtest.net
- 120+ Million Users in the US Don’t Use the Internet at Broadband Speeds
Even though the latest FCC Broadband Deployment Report shows that 95.6% of the US population has access to broadband internet, Microsoft data from October 2020 shows that 120.4 million don’t use the internet at speeds greater than or equal to benchmark broadband speeds (25/3 Mbps).
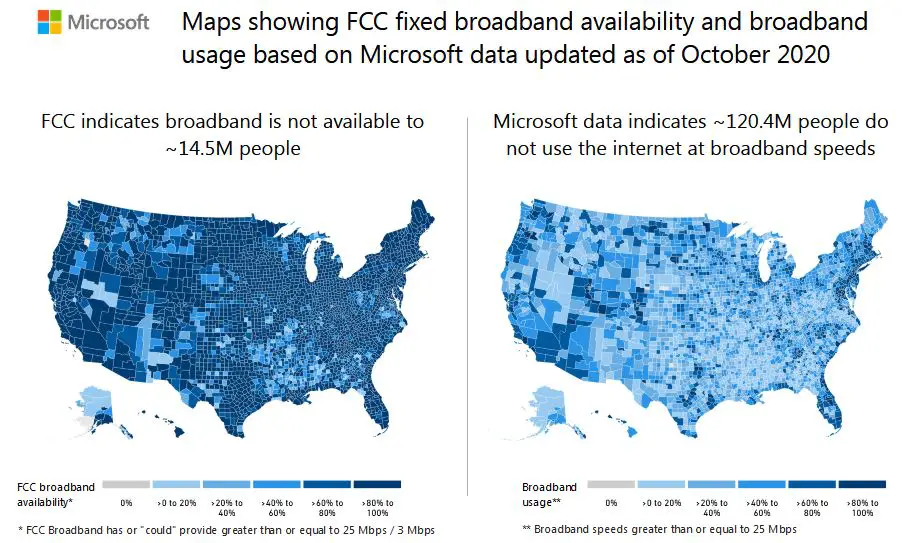
Source – Microsoft
Network Equipment Stats
As the number of internet users grows, every industry, even remotely related to the internet, grows with it. One of the first things that come to mind when speaking about the internet is network equipment (routers, modems, extenders, etc.). So, let’s see how the growth of the internet in 2021 affected the network equipment market.
- There Are More Than 1 Billion Active Routers in the World
If we assume that there’s only one router per household (either a separate unit or incorporated into a modem), and we take into account the number of internet users in each region of the world, as well as the average number of household members for each region, we can calculate that the number of active routers in the world is higher than 1 billion.
Sources – Internet World Stats, Pew Research Center, Australian Institute of Family Studies
- The Worth of the Wi-Fi Router Market
The estimated value of the Wi-Fi router market in 2020 was $10.5 billion. It is expected that the router market reach $17.1 billion by 2026. The estimated Compound Annual Growth Rate (or CAGR) for the Wi-Fi router market for the period 2021-2026 is 8.4%. Some sources estimate that the router market value will reach $33.96 billion by the end of 2030.
Sources – Mordor Intelligence, Allied Market Research
- Router Market Global Growth Rates
It is estimated that regions with the highest router market growth rates over the next 5-year period will be Asia and Australia. The US and Europe will have medium growth, while Central America, South America, the Caribbean region, and Africa will have the lowest market growth rate.
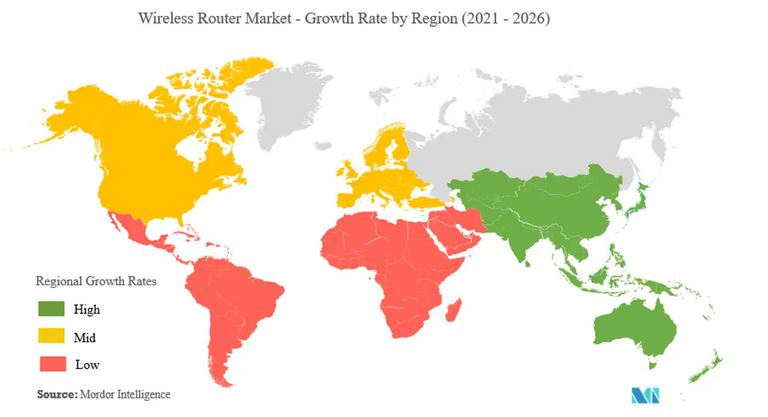
Source – Mordor Intelligence
- The Major Players on The Router Market
Five major Wi-Fi router manufacturers in the world are TP-Link, NETGEAR, D-Link, Linksys (Belkin), and Xiaomi. Together, they hold 60% market share.
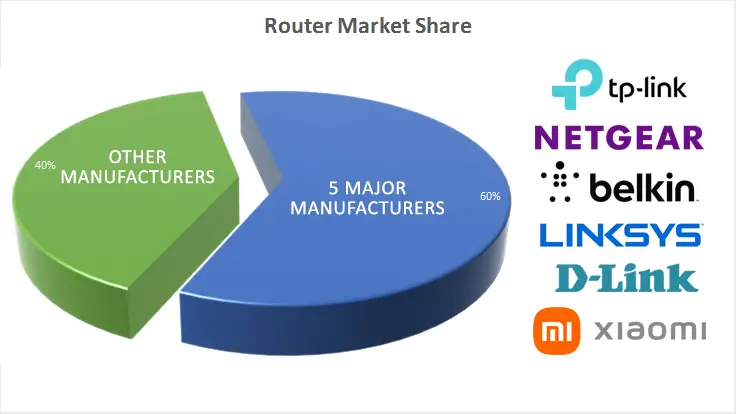
Source – Marketing Intelligence Data
- The Number of Devices in the World Capable of Connecting to Home Wi-Fi Routers
It is estimated that the total number of devices capable of connecting to our home routers in 2020 was 10.5 billion.
Source – Mordor Intelligence
- World Cable Modem Market Was Valued at $7.2 Billion in 2020
The estimated value of the global cable modem market in 2020 was $7.2 billion and it’s expected to grow at a CAGR of 4.8% and reach $10 billion by the end of 2027.
The estimated value of the US cable modem market in 2020 was $1.9 billion, while the highest-growing market is China (with a CAGR of 6.2%). Chinese cable modem market is expected to reach a value of $2.4 billion by the end of 2027.
Source – ReportLinker
- Global Range Extender Market is Growing Faster Than the Router Market
The worth of the global Wi-Fi range extender market (Wi-Fi extenders and repeaters) in 2020 was $1.25 billion. The estimated compound annual growth rate for the period 2021-2030 is 10.8%. Other sources, like Mordor Intelligence, predict even higher CAGR over a shorter period (16.44% for the period 2021-2026). The projections say the market value will reach $3.357 billion in 2030.
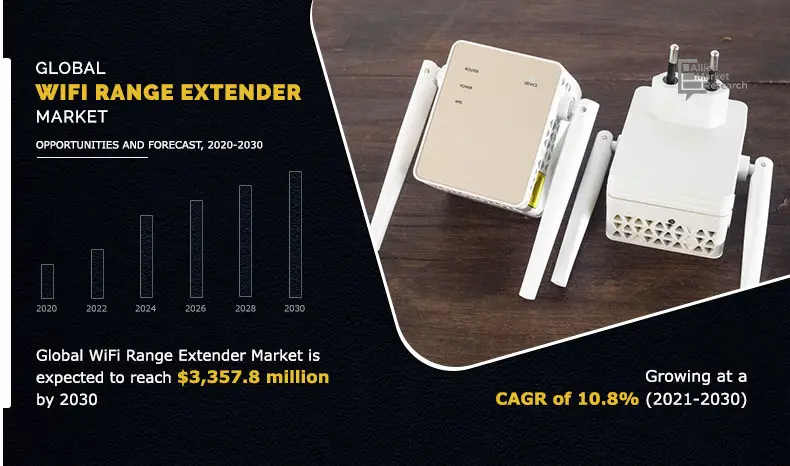
Source – Allied Market Research
Search Engines, Browsers, and Popular Searches in 2021
Can you imagine your life in 2021 without Google? Of course, you can’t. That’s why we have an entire section dedicated to stats about Google. Well, not just Google, but mostly Google.
- Most Popular Search Engines
There’s no doubt who’s the KING when it comes to search engines. Depending on the source, Google holds 85-92.5% of the global search engine market share. Google is and will probably be the undisputed leader in the global search engine market. All the other search engines together hold just 8-15% of the global market share. Bing has the highest market share after Google (2.86-6.79%). The third most popular search engine in the world is Yahoo (1.5-2.75%). They are followed by Russian Yandex, Chinese Baidu, and DuckDuckGo. Below, you can see the global search engine market share stats from two sources – Statista and StatCounter.
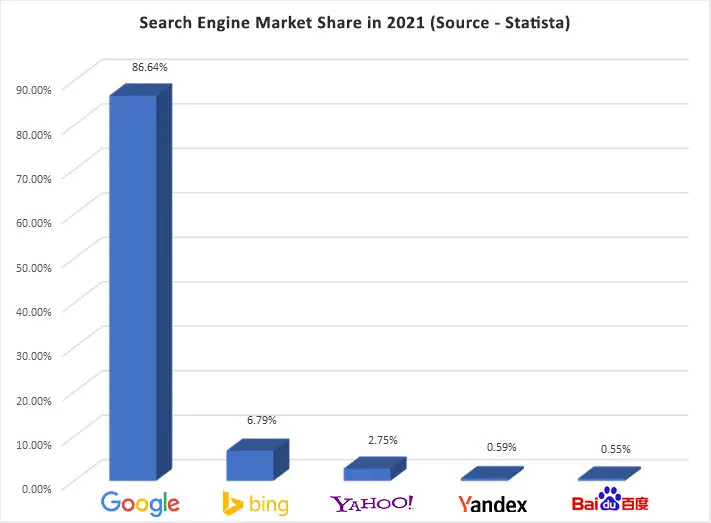
Source – Statista
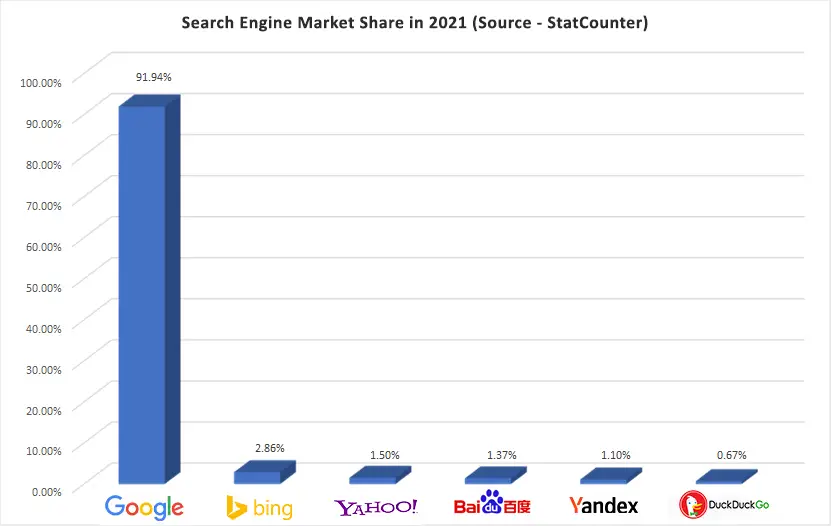
Source – StatCounter
- Google Holds 72.77% of the Search Engine Market Share in the US
According to Semrush Trends, Google is the most visited search engine in the US with a 72.77% share of all the search engine visits. Amazon is the second with 12.87%. Now, you may think that Amazon doesn’t qualify as a search engine because it’s an eCommerce website, but it has a search engine (called A9). The only difference is that Amazon’s search engine is product-based and doesn’t give answers to how-to queries. If you would eliminate Amazon’s search engine from this survey, you would get a very similar chart as those two above – Google would have approx. 85-90% market share.
Amazon’s search engine is followed by Yahoo (8.36%), Bing (2.93%), and DuckDuckGo (1.59%). Other search engines among top-ten are AOL (1.12%), Baidu (0.2%), Ask.com (0.07%), Ecosia (0.06%), and Yandex (0.03%).
Source – Semrush
- Baidu is Chinese Google
You may have never heard of Baidu, but believe us – you should know a few things about it. For starters, Baidu holds 76.9% of the search engine market share in China. Almost like Google in the US. The second most popular search engine in China is Sogou with 14.02%. Sogou is followed by Bing (3.65%) and Google (2.41%).
Just like Google, Baidu is much more than a search engine. As a Baidu user, you can access Baidu maps, Baidu Encyclopedia (called Baike), Baidu mail, etc. In total, Baidu offers 57 different services.
In China, there are 989 million internet users. 580 million internet users are also active Baidu users (544 million in December 2020). According to SEO Agency China, Baidu processes 6 billion daily queries.
All these Baidu stats make you wonder why is the global market share of Baidu so small. It looks like the companies doing surveys and all the research don’t even take Baidu’s users and market share in China into account. I mean, Baidu has 580 million users – that’s 11% of all internet users in the world. The fact that the global market share of Baidu is just 0.5-1.5% doesn’t really make sense.
Sources – Search Engine Journal, Statista, Baidu, SEO Agency China
- Google Processes More than 8.5 Billion Queries Every Day
According to Internet Live Stats, Google handles almost 100,000 queries every second. That amounts to 6 million queries per minute or more than 8.5 billion daily queries.
The number of daily handled queries increases constantly. In 2005, Google handled approx. 141 billion queries (for the whole year). Today, it can handle that number of queries in just 16 days.
Source – Internet Live Stats
- Top-Ten Most Searched Everyday Terms on Google (Globally)
During the 3rd quarter of 2021, YouTube and Facebook were globally the most searched terms. They were the only two terms with more than 1 billion searches (YouTube – 1.4B, Facebook 1.1B). Other popular searches were WhatsApp web (618 million), Google (543.3 million), Gmail (414 million), translate (414 million), weather (388.7 million), amazon (338 million), google translate (338 million), and Instagram (338 million).
Source – Semrush
- Top-Ten Most Searched Everyday Terms on Google (US)
Facebook and YouTube were also the most searched terms in the US (both with 151 million searches). The other top terms were amazon (124 million), Google (73 million), Walmart (68 million), Gmail (55.6 million), home depot (55.6 million), target (42.7 million), restaurants (42.7 million), and yahoo mail (40 million).
Source – Semrush
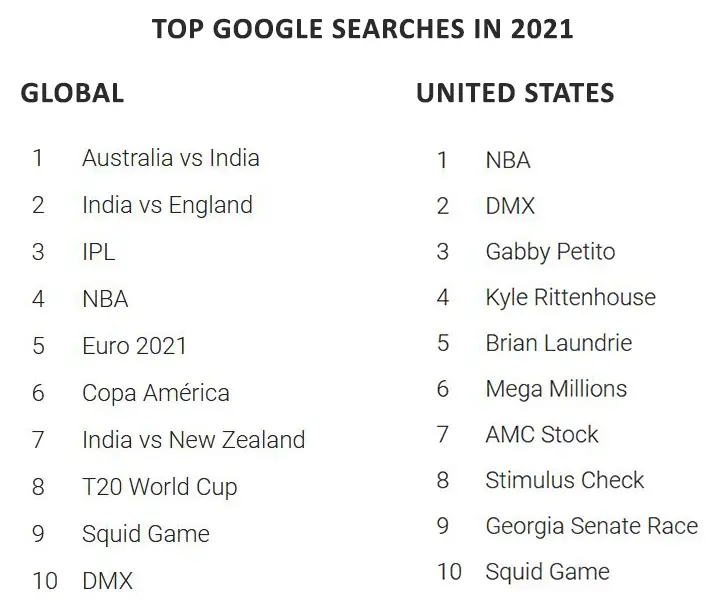
- Trending Google Searches in 2021
2021 was the Olympic year, which was supposed to be the largest sporting event (and the largest event in general), but none of the top-ten searches had anything to do with the Olympics. For comparison, Olympics were among the top ten searched terms (both globally and in the US) in 2012 and 2016.
Each of the first three most searched terms globally in 2021 had something to do with India and cricket. In fact, five of the top ten most searched terms in 2021 are related to India and cricket. Three additional non-India non-cricket popular searches were sports-related (NBA, Euro 2021, and Copa America). The remaining two popular searches were Squid Game (TV show) and DMX (tragically deceased rapper).
NBA and DMX are the two most searched terms in the US in 2021. The following three terms are related to tragedies that happened in 2021 (Gabby Petito, Kyle Rittenhouse, and Brian Laundrie). People in the US were also interested in Mega Millions (jackpot game), AMC Stocks, and stimulus checks. Georgia Senate Race and Squid Game complete the list of top-ten Google searches in 2021. So, 4 tragedies, 3 money-related searches, one basketball league, one political event, and one TV show. That’s 2021.
Source – Google Trends
- The Most Popular Desktop Browsers Worldwide
As of December 2021, Google Chrome holds 66.65% market share and is the leader in the global desktop browser market. Chrome is followed by Safari (9.54%), Edge (9.21%), Firefox (8.48%), Opera (2.94%), and Internet Explorer (1.08%)
Source – StatCounter
- The Most Popular Desktop Browsers in the US
The situation with internet browsers is similar in the US. Chrome is still dominant with 59.97% market share. Safari is more popular in the US than in the rest of the world (17.69%). Safari is followed by Edge (12.13), Firefox (6.68%), Internet Explorer (1.31%), and Opera (1.26%).
Source – StatCounter
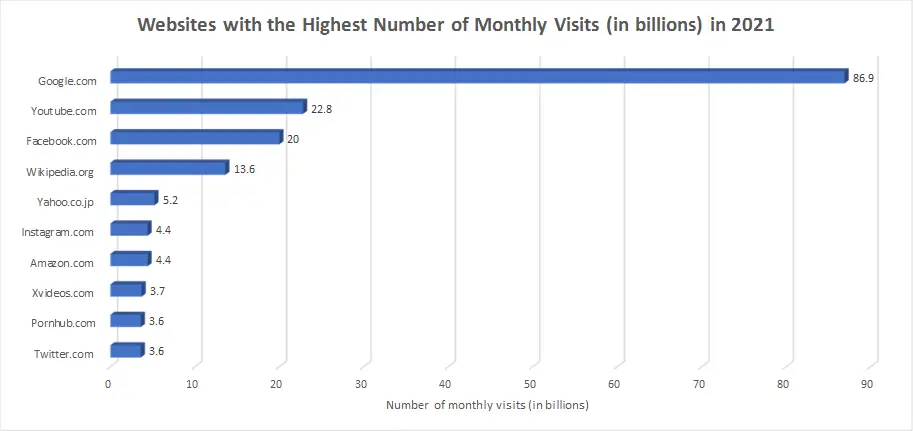
- The Most Visited Websites Worldwide
You won’t see anything surprising here. As of June 2021, the websites with the highest number of monthly visits in the world are Google.com (86.9B/month), Youtube.com (22.8B monthly visits), and Facebook.com (20B/month). The rest of the list is also predictable – Wikipedia.org (13.6B/month), Yahoo.co.jp (5.2B/month), Amazon.com (4.4B/month), Instagram.com (4.4B/month), xvideos.com (3.7B/month), Twitter.com (3.6B/month), Pornhub.com (3.6B/month).
Source – Statista
If you look at sources other than Statista, you may see different stats and maybe even different websites (at least some of them will be different). Especially if you try looking for the latest data. What’s so different you may ask? Well, the most important difference, according to Cloudflare, is that Google is not the number 1 anymore. And it wasn’t dethroned by YouTube or Facebook – it was dethroned by TikTok. Below, you can look at Cloudflare and Alexa rankings.
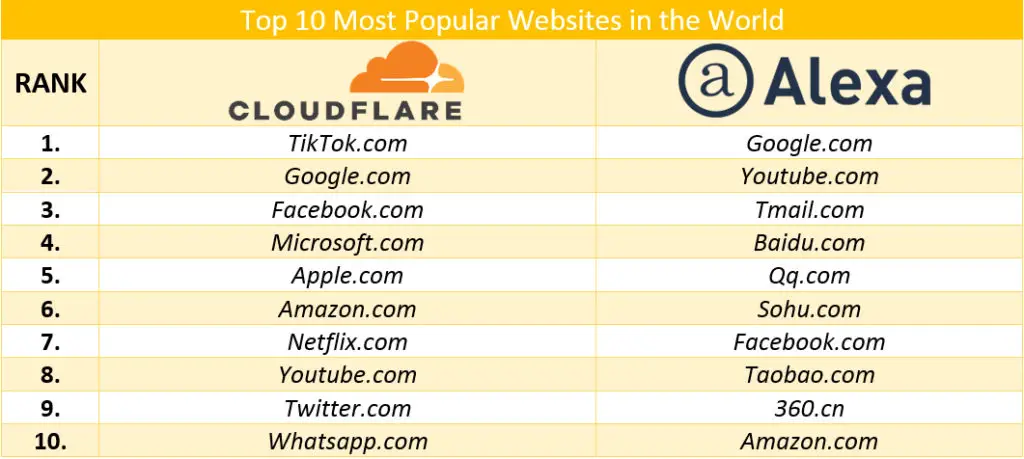
Sources – Cloudflare, Alexa
Unlike Cloudflare and Statista, Amazon Alexa lists quite a few Chinese websites (Baidu, Tmail, Qq.com, Sohu.com, Taobao.com, 360cn), which makes that list, at least in my eyes, a bit more realistic. China has almost 1B internet users, which is 20% of the entire internet world, so it’s perfectly natural to see a few Chinese websites on the list of the most visited websites in the world.
Most Visited Websites in the World Over Years (1996-2021)
- The Most Visited Websites in the US
Some websites like Google, Facebook, Youtube, Amazon, etc. are universally popular and are the most visited in the world and in the US, but there are some subtle differences. We will, again, combine a few relevant sources to get a better picture.
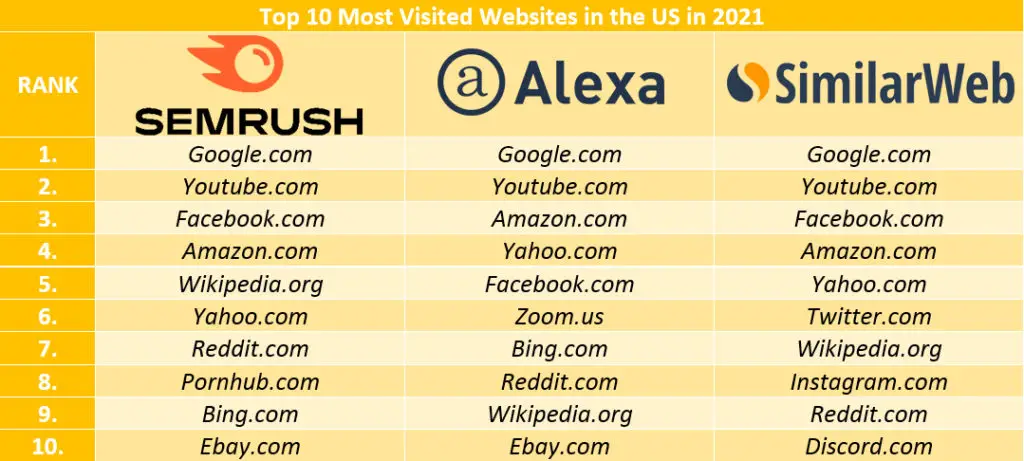
Sources – Semrush, Alexa, Similar Web

Website and Domain Stats
Most of us spend online time in our own internet bubbles. We visit the same websites and same social media every day. Occasionally, we leave our bubbles and get a chance to see how bigger the web is compared to our tiny bubbles. Have you ever wondered how big is the web? How many websites are there? How many registered domains and domain names? And what makes all those websites accessible? Here are some answers.
- The Number of Websites Will Soon Reach 2 Billion
At the moment of writing this article (Jan 2022), the total number of websites on the web is 1.92 billion and is growing every second. A huge portion (approx. 83%) of all these websites are inactive (aka parked domains). Only 200.7 million websites are active. As mentioned in the section “Historical Facts” (Fact No 3), the first website was created by Tim Berners-Lee in 1991. To get to one billion websites, we needed 23 years (1991-2014). The number of two billion websites will be reached in the next few years.
Source – Internet Live Stats, siteefy
- There Are 1,589 Registered Domains (like .com, .net, .us, .gov, .org)
As of January 2022, the IANA root domain database contains 1590 top-level domains (TLDs). Some of those top-level domains are retired (8), some are test domains (11), and some are not assigned (83). That leaves us 1488 domains.
All top-level domains can be divided into 4 groups:
TLD or gTLD (generic top-level domains) – .com, .net, .org, .info, .edu, .news. etc.
ccTLD (country-code top-level domains) – .us, .de, .uk, .in, etc.
ngTLD (new generic TLDs) -.ads, .agency, .club, .global, .gmbh, .ltd, .llc, .forum, .fyi, etc.
Geo ngTLD (Geo new generic TLDs) – .tokyo, .nyc, .london, .bayer, .wien, .berlin, .abudhabi, .boston,
Source – IANA, siteefy
- There Are 364.6 Million Registered Domain Names in the World
As of Q3 2021, the number of registered domain names is 364.6 million. The number of registered domain names decreased by 2.7 million compared to Q2 2021. Compared the Q3 2020, the number of registered domain names decreased by 6.1 million.
Source – Verisign
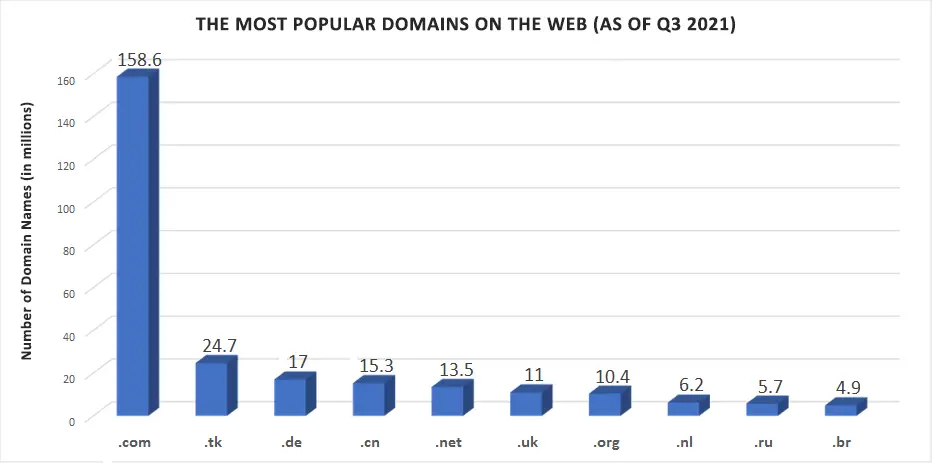
- The Most Popular Domain is .com
Of those 364.6 million registered domain names in the world, 158.6 million are using .com domain. So, 43.5% of all domain names use .com extension. The second most popular domain is .tk (country-code TLD for Tokelau) with 24.7 million domain names. The third most popular is .de (ccTLD for Germany), the fourth is .cn (ccTLD for China), and the fifth is .net.
Source – Verisign
- The Number of Registered Domain Names with ccTLDs Is 152.9 million
There are 152.9 million domains names with country code TLDs. The most popular country code top-level domains are .tk (24.7M), .de (17M), .cn (15.3M), .uk (11), .nl (6.2M), .ru (5.7M), .br (4.9M), .fr (3.8M), .eu (3.7M), and .it (3.4M).
.tk is the ccTLD of Tokelau. Tokelau is a group of three tropical coral atolls located in the southern Pacific Ocean. The population of Tokelau is approx. 1,500. It’s more than 55 thousand times smaller than Germany, yet it has more registered domains with its ccTLD than Germany. Or China. The reason for this is simple – Tokelau allows individuals and small businesses to register domain names with the .tk domain for free.
Sources – Verisign, Shopify
- Top Website Hosting Providers in 2021
In order to be accessible, every website has to be hosted by some hosting provider. Website host providers allocate space on their servers allowing website owners to store files, create, and publish new content. Everything a website owner wants to publish and wants others to see when they visit a website has to be stored on a server.
The global website hosting market is highly segmented. GoDaddy, Amazon, Google Cloud Platform, and 1&1 are, for example, very popular in the US, but other countries have their own providers and they are often the most popular providers in those regions/countries (123-Reg in the UK, Aruba in Italy, etc.).
According to Web Technology Surveys, the biggest players in the global website hosting market are Amazon (6.2% of all the websites are hosted by it), Newfold Digital Group (4.9%), Shopify (4.4%), GoDaddy group (4.2%), OVH (2.8%), Hetzner (2.8%), WP Engine Group (2.3%), Google (2.2%), SiteGround (2%), and DigitalOcean (1.9%). Top-ten global players in the hosting market hold 33.7% market share.
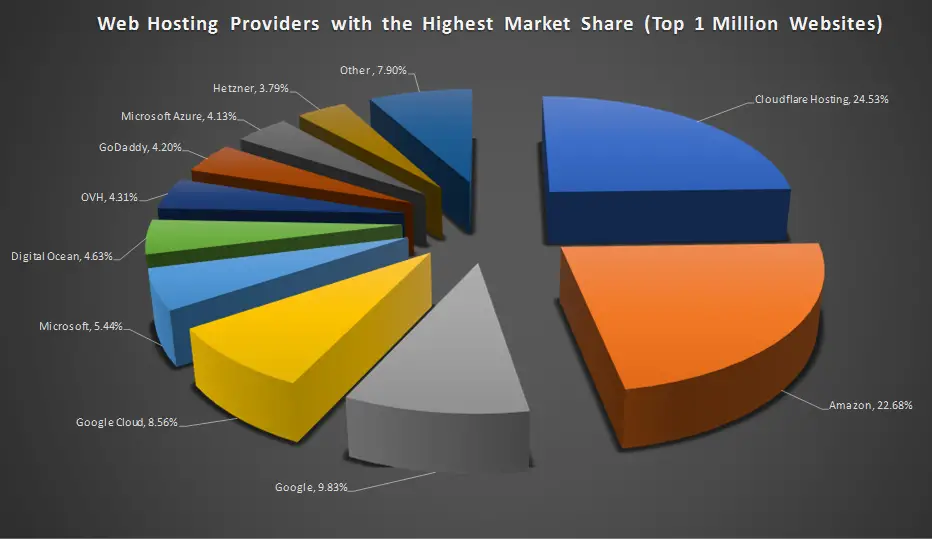
According to Builtwith, the most dominant web hosting providers among the top 1 million websites on the web are Cloudflare and Amazon. One thing to have in mind here is that Cloudflare is not exactly a hosting provider – it’s a DNS provider designed to improve your website’s performance, security, and reliability.
Sources – Findstack, Web Technology Surveys, Builtwith
- Top Website Builders and Content Management Systems
Building a website was much harder in the past than it is today. 15 years ago, it required lots of coding and lots of time. The cost of building a website was also very high. Today, you have simple and easy-to-use website builders and Content Management Systems. You can now build a website even if you don’t have any coding skills.
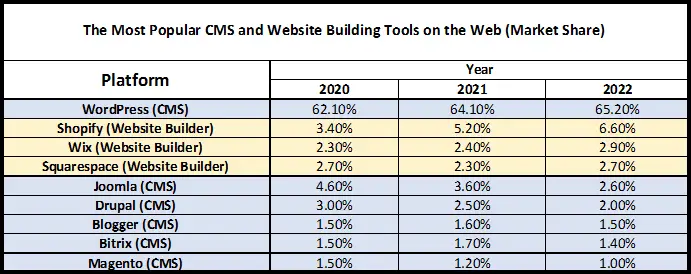
According to Web Technology Surveys, WordPress is, by far, the most popular tool for building a website. It holds 65.20% market share. WordPress is, by the way, a content management system. The other three most popular tools for building websites are actual website builders – Shopify (6.6%), Wix (2.9%), and Squarespace (2.7%). 33.8% of all the websites on the web don’t use CMS or website builders.
Source – Web Technology Surveys
One of the most common reasons why people go online is social media. Over the past 15 years, social media have evolved into a powerful tool. It’s not just something we use to get in touch with our high school friends and relatives. The influence of social media on our lives, even if don’t use them, is simply amazing. And the money that social media generate is huge.
The following stats will give you a better perspective on social media size and influence in 2021.
- The Number Active Social Media Users Worldwide is 4.55 Billion
As of October 2021, 4.55 billion are using at least one type of social media actively. This means that 57.6% of the entire world population uses some social media platform. Compared to the same period last year, the number of active social media users increased by 409 million (9.9% growth). In 2.5 years (since April 2019), the number of social media users increased by 1 billion. The average number of monthly used social media platforms per internet user is 6.7.
Source – DataReportal
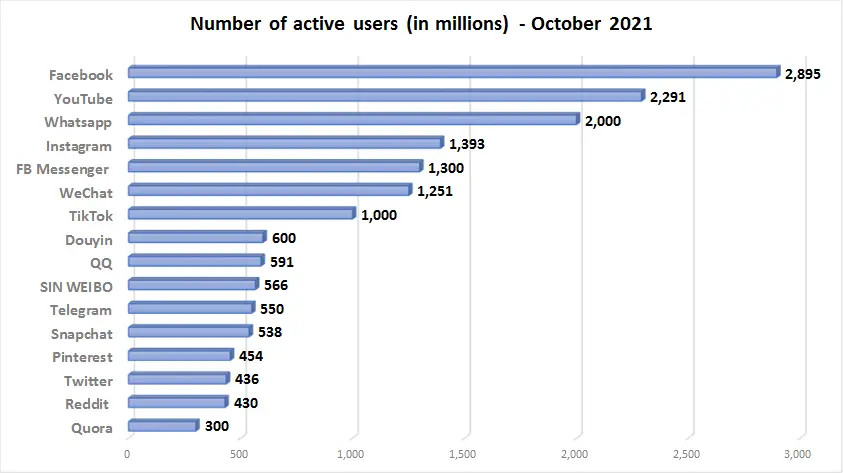
- The Most Popular Social Media Platform Worldwide is Facebook
You will hardly be surprised by this stat. As of October 2021, Facebook has 2.9 billion active users. According to the latest data from Internet Live Stats, the number of active Facebook users actually reached 3 billion. It’s followed by YouTube (2.3 billion users), Whatsapp (2 billion users), Instagram (1.39 billion users), and FB Messenger (1.3 billion users). The most used social media app in China is WeChat. Globally, WeChat has 1.25 billion active users. TikTok reached 1 billion users at the end of 2021.
Source – Statista, DataReportal
- The Most Popular Social Media Platform in The US is YouTube
According to the research conducted by the Pew Research Center, as of February 2021, the most popular social media platform in the US is YouTube – it’s used by 81% of adults. The only other platform that comes close to YouTube is Facebook (69% of US adults use Facebook). The next in line is Instagram, which is used by 40% of US adults. Other popular social media in the US are Pinterest (31%), LinkedIn (28%), Snapchat (25%), WhatsApp (23%), Twitter (23%), TikTok (21%), and Reddit (18%).
Source – Pew Research Center
- An Average Internet User Has 8.4 Social Media Accounts
As of January 2021, the average number of social media accounts per internet user worldwide is 8.4. Not all these accounts are necessarily active. Internet users in India have 11.4 internet accounts on average. Internet users in the US have 7.1 accounts, while internet users in Japan have only 3.8 accounts per user.
Source – DataReportal
- Reasons for Using Social Media Have Changed
Yeah, they have definitely changed. The primary reasons for using social media ten years ago were staying in touch with friends and meeting new people. These two are still among the top-ten reasons but are not primary. The most common reason for using social media is staying up-to-date with current events (36.5%). The second reason is looking for entertaining content (35%). Staying in touch with friends is the fourth reason (33%). People also use social media to research products they want to buy (27.5%) or because they want to share their opinion with others (23.4%). 20.3% of internet users are using social media for work purposes.
According to the study conducted by the Pew Research Center in January 2021, 52% of US adults prefer getting news on digital platforms and 86% of adults are using digital platforms for news (at least occasionally). 23% of US adults get most of their news through social media, while 53% of adults are using social media for news occasionally. 11% of adults prefer getting news through social media and use it as a primary source of information. 42% of US adults aged 18-29 often use social media to get news. Adults from this age group are more likely to use social media than news websites/apps (28%) or search (28%).
Another study done by Pew Research Center in November 2021 shows that 19% of US adults get their news through social media often, while 29% get news sometimes. 31% of Americans get news on Facebook regularly. More than half of Twitter users in the US (55%) use Twitter regularly to get the latest news.
Sources – DataReportal, Pew Research Center, Semrush
- Since 2012, The Average Daily Time Spent on Social Media Worldwide Increased By 57 Minutes
As of October 2021, the average time internet users spend daily on social media increased from 90 min/day to 147 min/day.
Source – Data Reportal
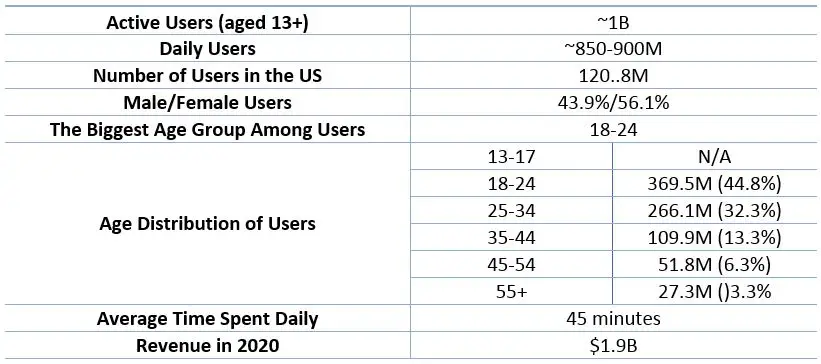
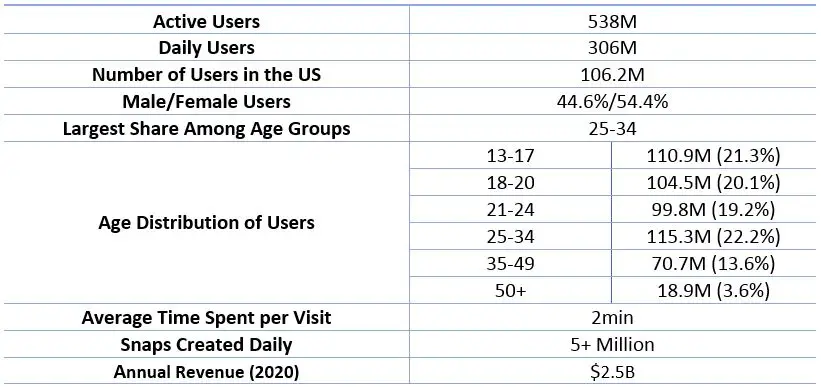
- Essential Facebook Stats
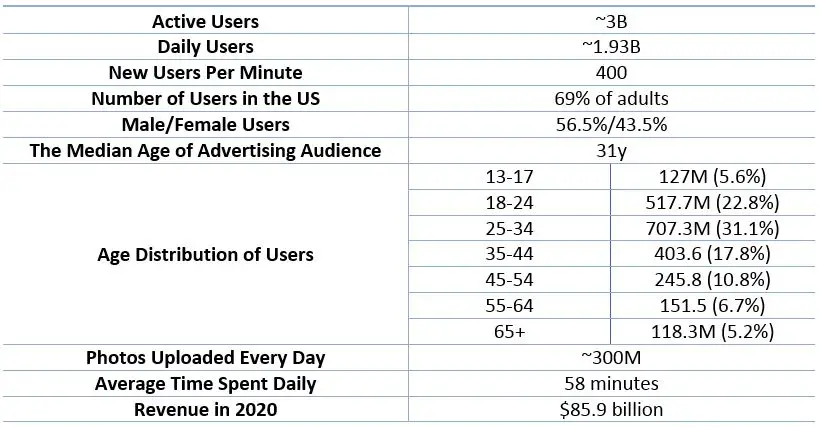
Sources – DataReportal, Tech Jury, Broadband Search, Insider Intelligence, Business of Apps
- Essential YouTube Stats
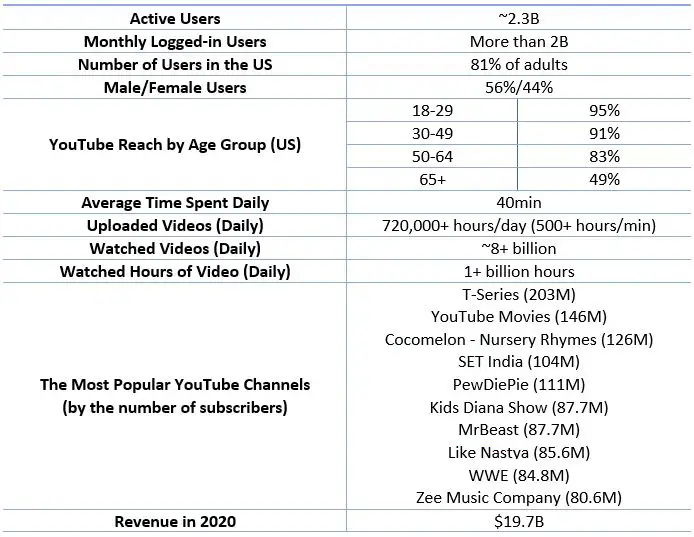
Source – DataReportal, Hootsuite, Broadband Search, Insider Intelligence, Business of Apps, YouTube, Pew Research Center, Social Blade
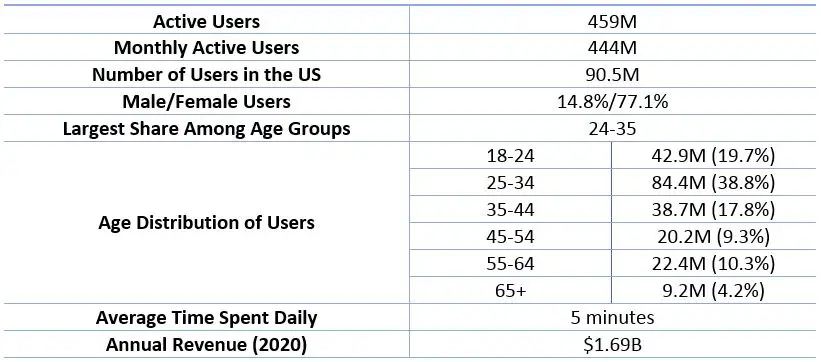
- Essential Instagram Stats
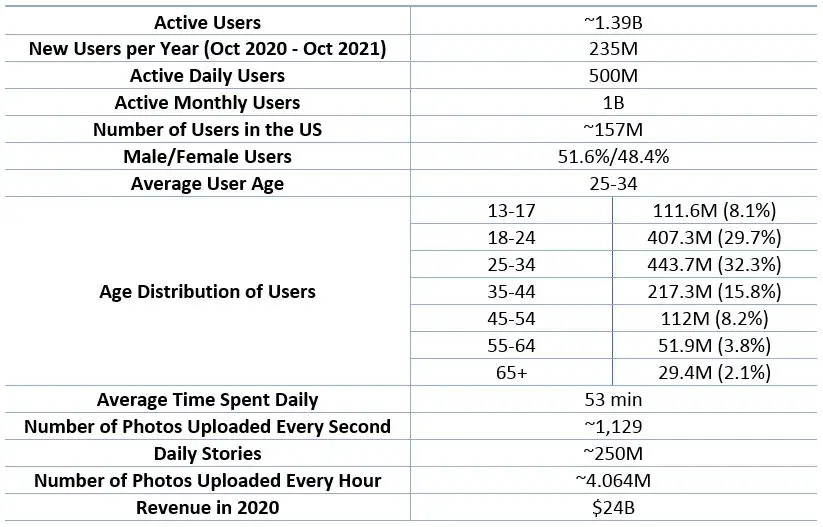
Source – DataReportal, Tech Jury, Broadband Search, Insider Intelligence, BACKLINKO, Internet Live Stats
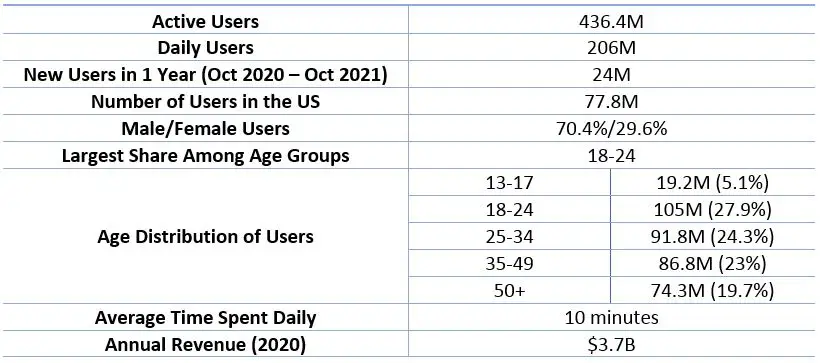
- Essential TikTok Stats
Source – DataReportal, Tech Jury, Broadband Search, Insider Intelligence, Business of Apps, Backlinko
- Essential Pinterest Stats
Source – DataReportal, Tech Jury, Broadband Search, Insider Intelligence
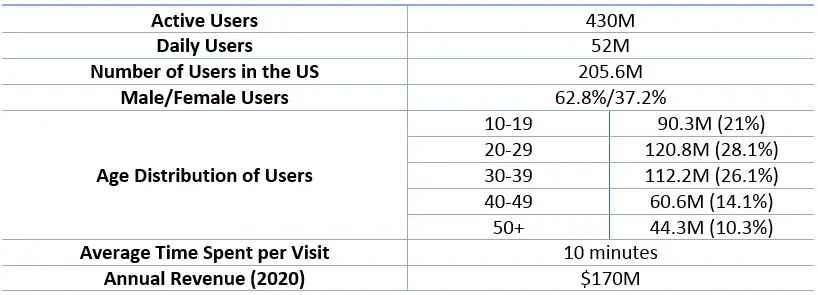
- Essential Twitter Stats
Source – DataReportal, Tech Jury, Broadband Search, Insider Intelligence, Backlinko, Similar Web
- Essential Reddit Stats
Source – Tech Jury, Broadband Search, Insider Intelligence, Statista, Business of Apps, Similar Web, Backlinko
- Essential Snapchat Stats
Source – DataReportal, Tech Jury, Broadband Search, Insider Intelligence, Business of Apps

Mobile Internet Stats
I remember getting my first phone in 2005. It was a big deal for me. That phone became an important part of my life, but compared to my today’s phone, it wasn’t really that important. Back in 2005 I just used phones for calls and messages. The most important thing in it was my contacts. Mobile Internet was too slow and using it was too much of a hassle. The introduction of the first iPhone (2007) and first Android (2008) and the development of mobile internet infrastructure (3G, 4G, 5G), changed the way we use our phones and access the internet.
The following mobile internet stats will give you some insights on mobile internet coverage, penetration, and global mobile internet use.
- 5.22 Billion People Worldwide Use Mobile Phones
More than two-thirds of the entire world population use mobile phones. 66.6% to be more precise. The percentage of users is even higher if you exclude people younger than 13 from the equation. In that case, 85% of all people worldwide use mobile phones. From Jan 2020 to Jan 2021, the number of people who use mobile phones increased by 93 million.
GSMA – The State of Mobile Internet Connectivity 2021, Data Reportal
- More Than 50% of Global Web Traffic Comes from Phones
According to various sources (Statista, Data Reportal, Statista), people use their phones to go online more often than other devices (computers, tablets, etc.). The most often stated mobile share of web traffic is around 54%. Some sources claim that up to 70% of all web traffic comes from phones. This doesn’t necessarily mean that all those phones use mobile internet, at least not all the time. In fact, most of the phones used for internet-related activities are connected to Wi-Fi.
Back in 2009, almost all web traffic was coming from desktop computers. In just 6 years (since October 2016), mobile and tablet internet usage exceeded desktop usage.
- Average Time Mobile Users Spend on Their Phones Worldwide is 4h 10min
People are getting quite addicted to their phones. The average time spent on phones is increasing year over year. Currently, mobile users spend most of their time using apps (92% of the time). 8% of the time is spent on using web browsers.
Source – GSMA
- 97% of Americans Have Some Kind of Cellphone
As of February 2021, 97% of adult Americans have a cellphone. 85% of adult Americans own a smartphone. Among the population aged 18-49 95.5% own a smartphone.
Source – Pew Research Center
- More Than Half of the World Population Uses Mobile Internet
According to GSMA’s State of Mobile Internet Connectivity 2021 Report (figures from 2020), 51% of the world population uses mobile internet. That’s 4 billion people. According to the same report, 43% of the world population has access to mobile internet but doesn’t use it, while 6% (450 million) of the world population doesn’t have access to mobile internet.
World regions with the best mobile internet coverage and the highest number of mobile internet users are North America (99% have access to mobile internet, 77% use mobile internet), Europe, and Central Asia (97% coverage, 72% usage). The region with the worst coverage is Africa (81%). In Africa, only 28% of the population (300 million people) is connected. In all other regions of the world, the coverage is 94% or higher.
Statista’s mobile internet usage stats show that the number of internet users worldwide reached 4.3 billion. Another Statista chart shows that the average number of mobile broadband internet subscriptions in 2021 per 100 inhabitants was 83. This doesn’t mean that 83% of the world population uses mobile internet because many people have two or three smartphones and each of these smartphones comes with a separate mobile internet subscription.
Sources – GSMA, Statista
- 66% of the Monthly Mobile Data Volume is Spent on Video Apps
As you may know, video streaming is one of the most demanding online activities in terms of bandwidth and data consumption. So, it’s not a surprise that most of the mobile data volume is spent on video streaming (YouTube, Netflix, etc.). 10.1% of data volume is spent on social media. Other online activities that consume a significant portion of data volume are software updates (3.9%), web browsing (3.2%), audio streaming (1.7%), and file sharing (0.7%).
Source – Statista
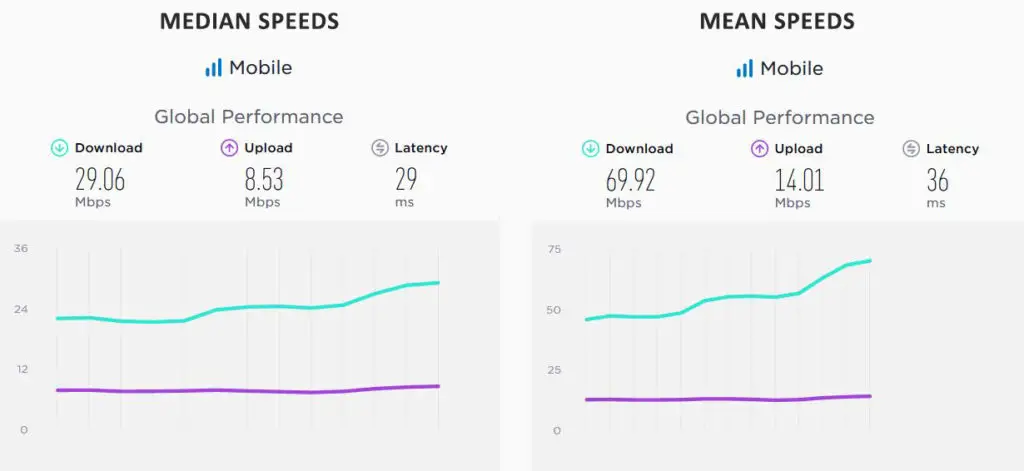
- Average and Median Mobile Internet Speeds Worldwide
Global mobile internet speeds are, expectedly, lower than global fixed broadband speeds. Global mean download/upload speeds are 69.9/14 Mbps. Global median speeds are somewhat lower –download speed is close to 30 Mbps, while the median upload speed is 8.5 Mbps.
Source – speedtest.net
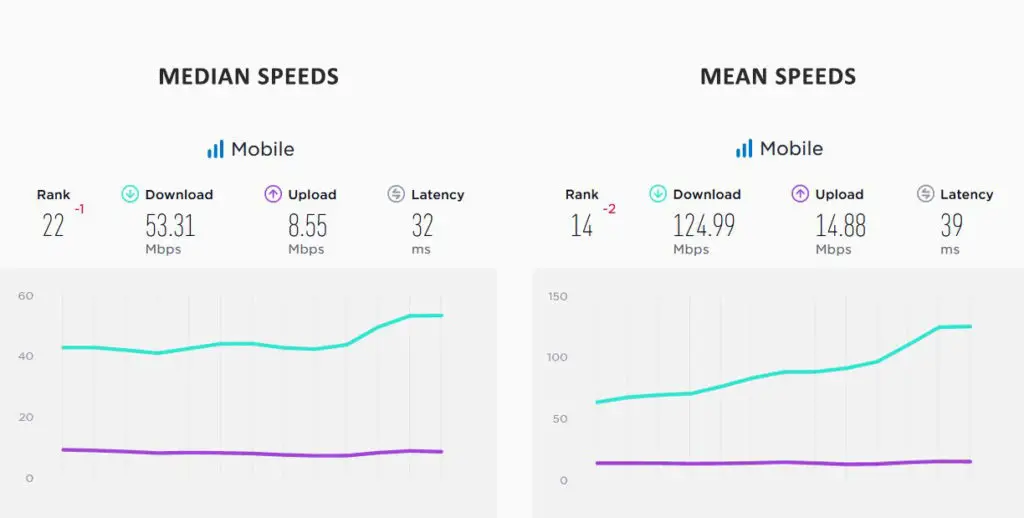
- Average and Median Mobile Internet Speeds in the US
The US has the 22nd highest median download/upload speeds in the world and the 14th highest mean download speeds. The median download is 53.3 Mbps, while the upload is 8.5 Mbps. The mean speeds are 125 Mbps and 14.88 Mbps.
Source – speedtest.net
- Countries with The Highest/Lowest Median Mobile Internet Speeds in the World
Countries with the highest median mobile download speeds are UAE (136.42 Mbps), Norway (116.6 Mbps), and South Korea (104.98 Mbps). On the other hand, countries with the lowest mobile internet speeds in the world are Afghanistan (5.24 Mbps), Palestine (5.68 Mbps), and Venezuela (5.76 Mbps).
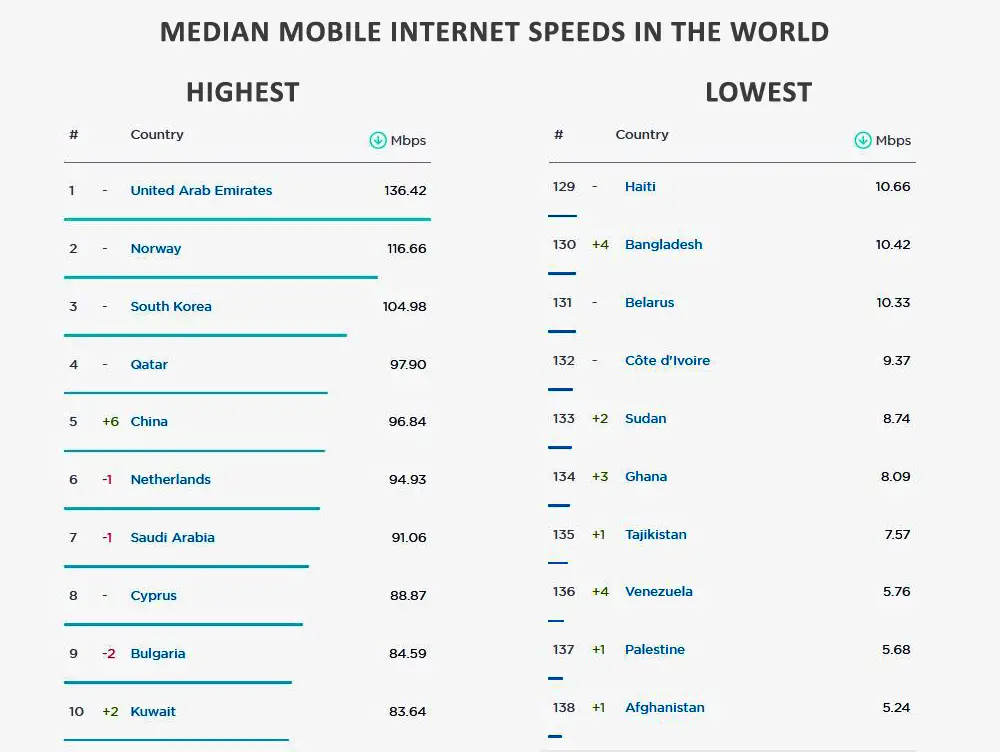
Source – speedtest.net
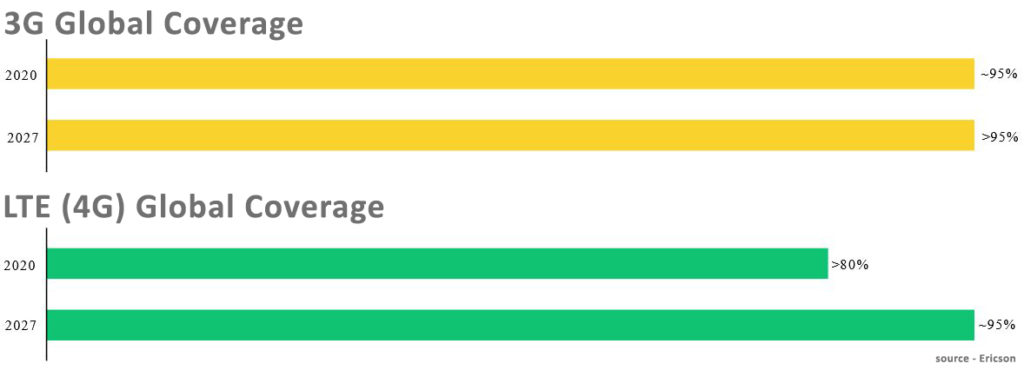
- Global 4G Coverage
According to Ericson, global 4G coverage has surpassed 80% in 2020. The 4G coverage is expected to reach 95% of the world population by 2027.
GSMA’s State of Mobile Connectivity report shows that the 4G coverage is best in high-income countries, especially in North America and Europe (up to 95%). 4G coverage in China in 2020 was 91%. Regions with the lowest 4G coverage in the world in 2020 were Sub-Saharan Africa (approx. 50% coverage), the Middle East, and North Africa (below 70% coverage).
- Global 5G Coverage
The implementation of the 5G network began in 2019. As you probably know, 5G is supposed to revolutionize mobile internet use and bring huge improvements over 4G.
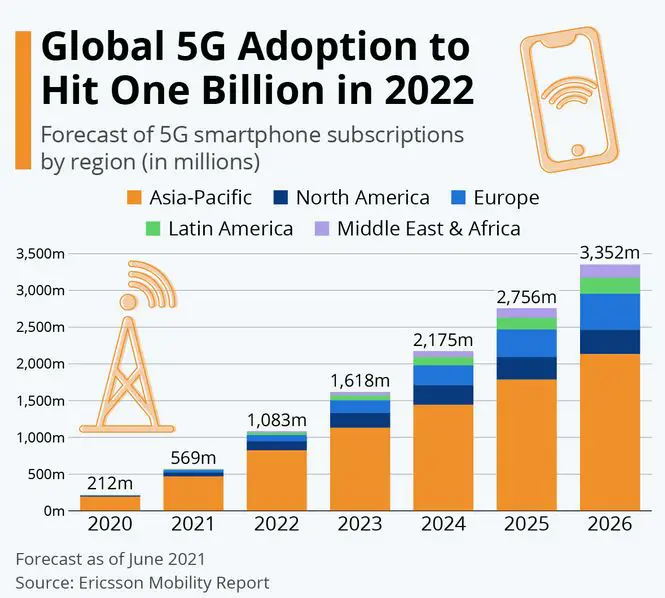
According to Ericson, the global 5G coverage in 2020 was approx. 15%. GSMA data shows that North America had the best 5G coverage in 2020 (76%). 5G population coverage in East Asia and Pacific was 28%. In Europe, the coverage was 24%. Other regions had less than 5% coverage. The global 5G coverage at the end of 2020, according to GSMA, was 17%.
The latest Ericson Mobility report (Nov 2021) claims that the number of 5G subscriptions will reach 660 million by the end of 2021, and is expected to reach 4.4 billion by 2027. In North America, 5G subscriptions will account for 90% (in 2027) of all mobile internet subscriptions.
Ericson predicts that 5G coverage will reach 2 billion people by the end of 2021. The estimated global 5G coverage by 2027 will be around 75%.
Sources – Ericson Mobility Report, GSMA State of Mobile Internet Connectivity Report 2021, Statista
- Countries with The Best 5G Coverage
As of August 2021, countries with the best 5G coverage are South Korea (28.1%), Saudi Arabia (26.6%), Kuwait (26.3%), Hong Kong (25.3%), USA (20.8%), Thailand (18.3%), Taiwan (15.8%), and Italy (14.9%).

Source – Statista, Open Signal
- 98.8% of All Social Media Users in the World Use Phones to Access Social Media
According to Data Reportal, 98.8% of social media users use their phones (most of them exclusively) to access social media.
Statista research shows that 98.5% of all Facebook users use phones to access Facebook. 81.8% of Facebook users use exclusively phones, while 16.7% use both – phones and computers. Only 1.5% of Facebook users use exclusively computers.
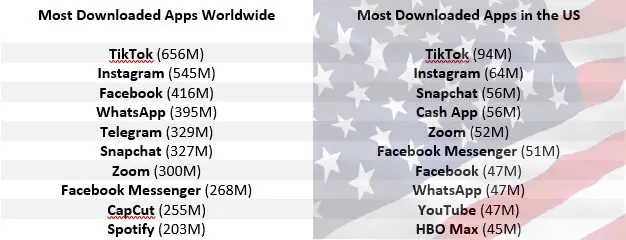
- The Most Downloaded Apps in the World (Non-Gaming Apps)
Social media apps dominate the global market and are the most downloaded apps in the US. On both lists, the first two places belong to TikTok and Instagram.
Of 10 apps on the top-ten global list 8 are social media and messaging apps. CapCut app is a video editor that most Instagram and TikTok users use to edit their videos. Spotify is the only audio streaming app that made the cut.
When it comes to US top-ten list, we have 8 social media and messaging apps, one e-banking app (Cash App), and one streaming app (HBO Max).
Source – Apptopia
Video and Music Streaming Stats
Music and video streaming services have entered our lives 10 years ago, and we already can’t imagine our lives without them. They really make everything easier – they save us a lot of time and don’t cost much. Here are some of the most interesting facts and stats about your favorite music and video streaming apps.
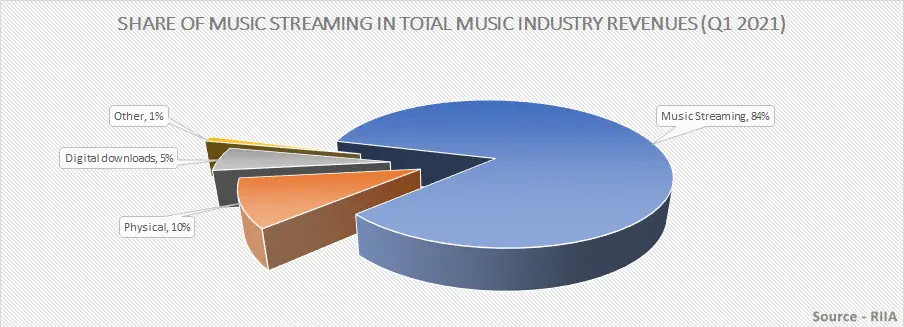
- Music Streaming Is the Dominant Form of Music Listening in the US
A huge portion of the music industry revenues in 2020 and Q1 2021 came from music streaming. According to RIIA, 84% of all the revenues in Q1 2021 were generated through music streaming. 10% comes from physical audio carriers, mostly vinyl. Back in 2015, only 35% of total music industry revenue was generated through streaming.
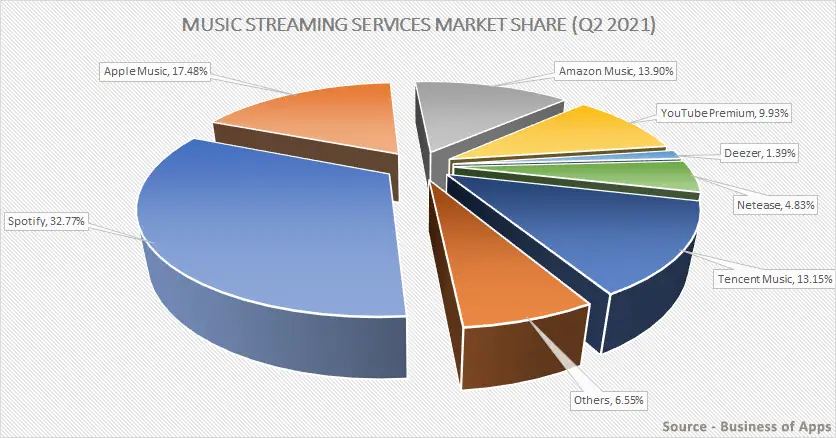
- Spotify is The Most Popular Music Streaming Platform Worldwide
Spotify holds 32-34% of the global music streaming market share. The total number of users, as of March 2021, is 356M. The number of subscribers (those who pay) is 165M. Other popular music streaming services are Apple Music (88M subscribers), Amazon Music (70M), YouTube Premium (50M), Deezer (7M), Pandora (6M), and Tidal (3M).
Sources – Business of Apps
- YouTube Still Has the Highest Number of Users
While Spotify has the highest number of paid subscribers, YouTube and Tencent (Chinese music streaming service) lead the race when it comes to the total number of users with 2.3B and 841M users respectively. However, we should bear in mind that both YouTube and Tencent are also (or rather primarily) video streaming services. The third most popular music streaming service is Spotify (365M users). The fourth, fifth, and sixth are Netease Music (183M), Apple Music (88M), and SoundCloud (76M).
Source – Business of Apps
- Netflix Is the Most Popular Video Streaming Service Worldwide
In September 2020, Netflix was the first video streaming service to reach 200 million subscribers. The latest reports show that Netflix had 213 million subscribers at the end of Q3 2021. These numbers make it the biggest player on the global market. Netflix is the number one streaming service in the US, Canada, UK, Australia, and numerous countries in Europe.
According to Statista research from September 2020, Netflix had 192 million subscribers worldwide. The second was Amazon Prime Video with 117 million subscribers.
The only major markets where Netflix doesn’t hold the biggest share are India, China, and Turkey. Disney+ is the most popular streaming service in India. China has its own streaming services – the most popular ones are Tencent and iQiyi. The biggest streaming service in Turkey is BluTV.
Disney+ is the fastest-growing video streaming service worldwide, mostly due to its popularity in India. India is, after China, the country with the biggest number of internet users in the world (755.8 million users with just 54.2% penetration). Statista expects Disney+ to outpace Amazon Prime Video and Netflix by 2026.
Sources – TV Technology, MediaPlayNews, JustWatch, Statista
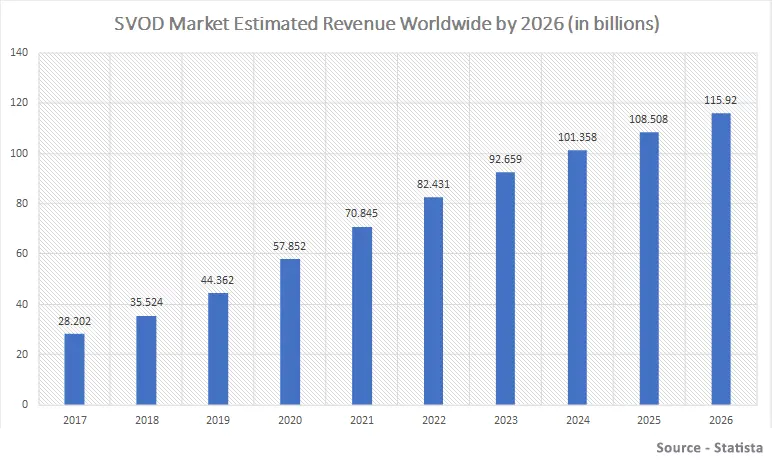
- The Estimated Global Video Streaming Market Revenue in 2021 was $70.8 Billion
Figures published by Statista (last updated in October 2021) show that the expected revenue of SVoD services worldwide will reach $70.8 billion by the end of 2021. It also predicts that the market will reach $115.9 billion by the end of 2026.
Source – Statista
- Netflix and Amazon Prime Video Are the Leading Streaming Services in the US
As of Q3 2021, Netflix holds the greatest share of the streaming service market in the US (27%). Amazon Prime Video is close behind with 21%. Disney+ holds 14%. Other popular services are Hulu (13%), HBO Max (10%), Apple TV+ (4%), and Showtime (2%). The remaining 9% is held by various other streaming services.
Sources – tvtechnology.com, JustWatch
- 37% of Adult US Viewers Say that Netflix Has the Best Content
According to a survey conducted by Morning Consult, the majority of adult viewers say that Netflix has the highest-quality content. 11% picked Amazon Prime Video, 10% voted for Hulu, and 9% think that HBO Max has the best content. 8% of viewers believe that Disney+ has the best content and only 2% selected Apple TV+.
Source – Morning Consult
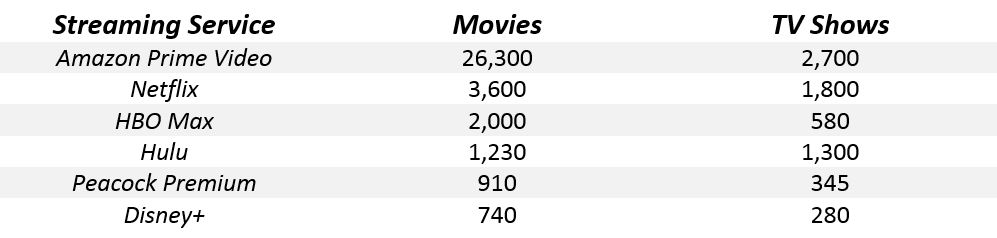
- Amazon Prime Video Has the Largest Video and TV Show Library
Amazon Prime has, by far, the biggest media library with more than 26,300 movies and 2,700 TV shows. In fact, Amazon has more movies in its database than the next 5 services together.
Sources – Business of Apps, JustWatch
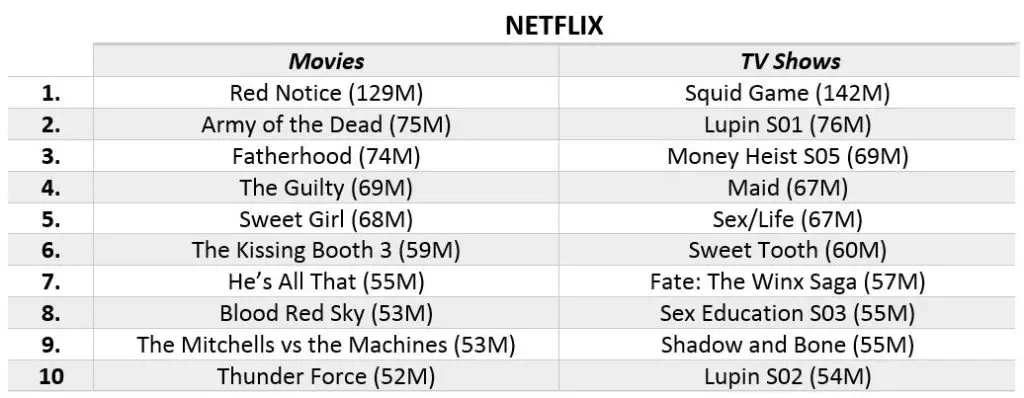
- Top Movies and TV Shows in 2021 on Various Streaming Services
Below, you can find the most popular and most-streamed movies and TV shows on Netflix, Amazon Prime Video, Disney+, Hulu, and HBO Max. For some services (Netflix, Disney+, Hulu), we were able to find official press releases, and for some (Amazon Prime, HBO Max) we had to rely on some unofficial sources.
Source – Yahoo News
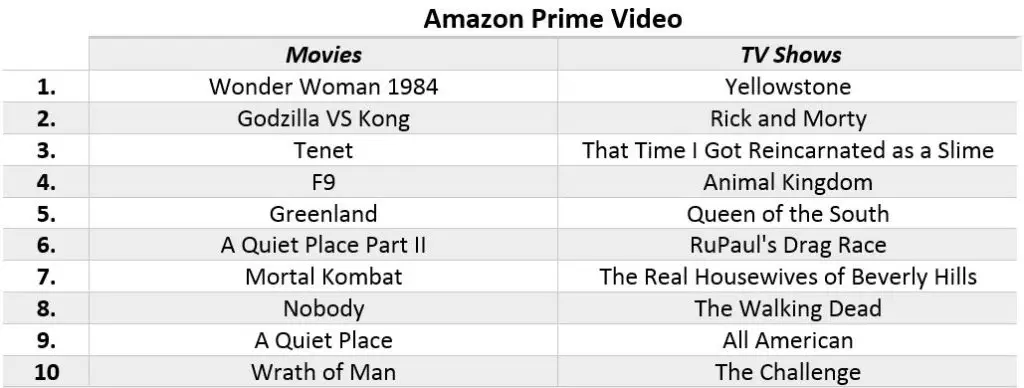
Source – Flix Patrol
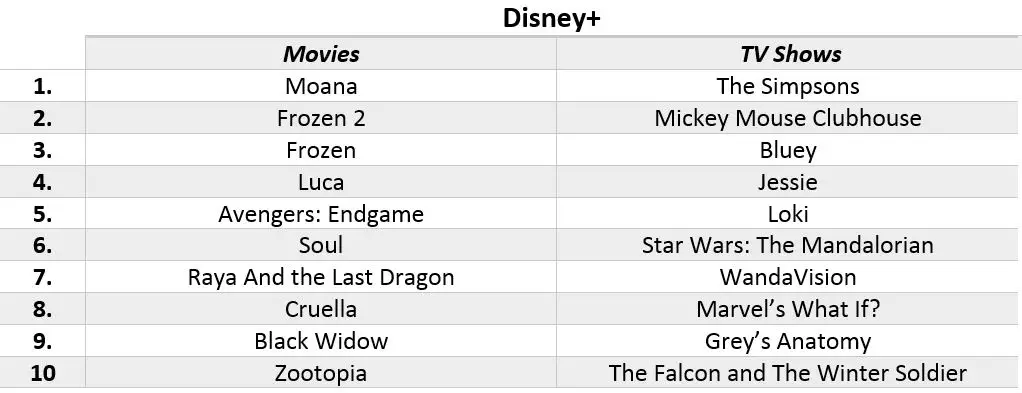
Source – What’s on Disney+
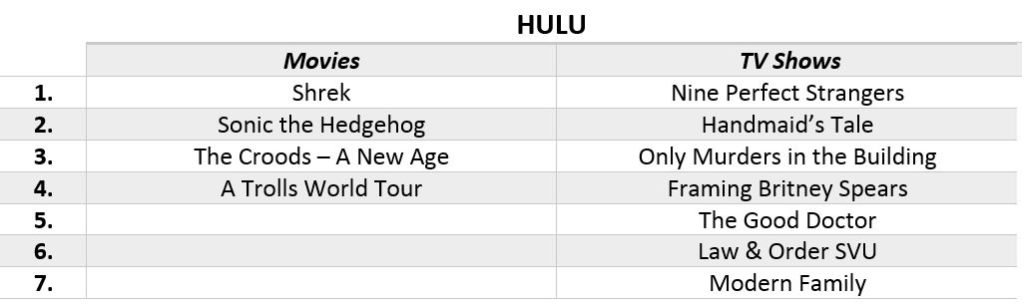
Source – Hulu
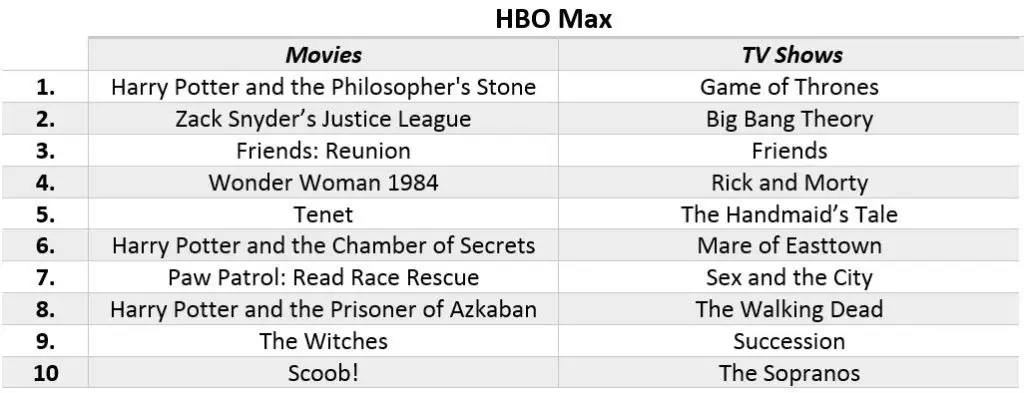
Source – Flix Patrol
eCommerce Stats
Many businesses went bust during the past two COVID years, but not eCommerce. Ecommerce platforms, in fact, benefited hugely from the situation because they were perfectly equipped for it. Here are some stats that will make your head spin.
- e-Retail Sales in 2021 Surpassed $4.89 Trillion
You can immediately see how big the global eCommerce market is. We’re talking about trillions here, not billions. At the end of 2020, the number was $4.28 trillion. So, in just one year, it recorded a $0.69 trillion increase or $690 billion. That’s bigger than the GDP of some developed countries. The GDP of Sweden in 2021, for example, was 550 billion. The GDP of Germany in 2021 was $3.96 trillion – smaller than the global value of e-retail sales.
Sources – findstack.com, Statista
- In 2020, Global e-Retail Sales Increased by 27.6%
In just one-year period, worldwide eCommerce retail sales recorded a huge growth. The reasons are simple, and we all know them. eCommerce would certainly record significant growth, even without the pandemic, but it’s pretty safe to say that COVID-19 was the biggest reason for such an increase.
Source – eMarketer
- 18% of Global Retail Sales in 2020 Were e-Retail Sales
In 2020, the share of e-retail sales in global retail sales was 18%. Statista estimates that in 2021 the share of e-retail sales will increase to 19.5%. The projected share for 2024 is 21.8%.
Source – Statista
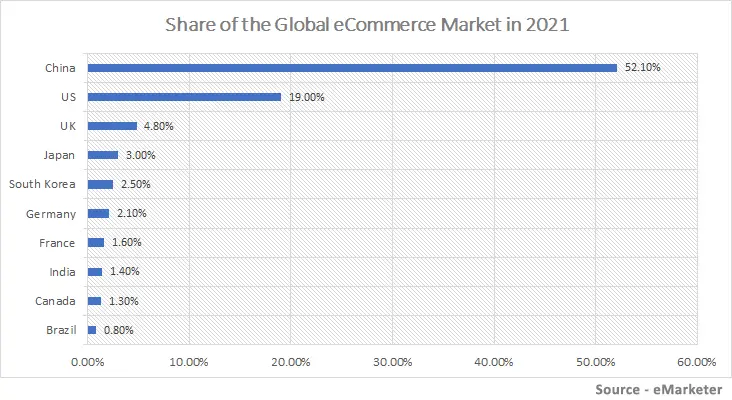
- Top eCommerce Markets
Asia-Pacific region is, by far, the largest eCommerce market. Of those global e-retail sales in 2021 we’ve mentioned ($4.89 trillion), more than half ($2.992 trillion) was generated in this region.
When talking about individual countries, China is and will be for the years to come, the biggest eCommerce market.
eMarketer estimation from May 2021 shows that China will account for more than half of e-retail sales in the world in 2021 (52.1%). The US will take the distant second place with 19% of the global eCommerce share.
The fastest-growing markets in the world will be India (27% growth), Brazil (26.8%), Russia (26.1%), Argentina (26%), and Mexico (21.1%).
Source – eMarketer
- Amazon is the Biggest eCommerce Platform in the World
According to Statista (July 2021), has the highest market cap of all the eCommerce platforms in the world. The value of Amazon.com, as of July 2021, is $1.735 trillion. Market caps of the second and all the other big eCommerce companies in the world are much lower. The second is Alibaba.com with $614.8 billion. The next in line are Shopify ($182.1B), PinDuoDuo ($159.2B), Prosus ($158B), JD.com ($123B), Uber ($94.1B), Airbnb ($93.2B), Booking.com (89.8%), etc.
Source – Statista
- More Than 230 Million People in the US are Digital Buyers
The number of online shoppers in the US is constantly increasing. In 2016, it was 209.6M. In 2020, the number raised to 227.5M. It is estimated that the number of buyers will reach 230.5M by the end of 2021. Statista projects that the number of online buyers in the US will reach 273M by 2025.
Sources – Oberlo, Statista
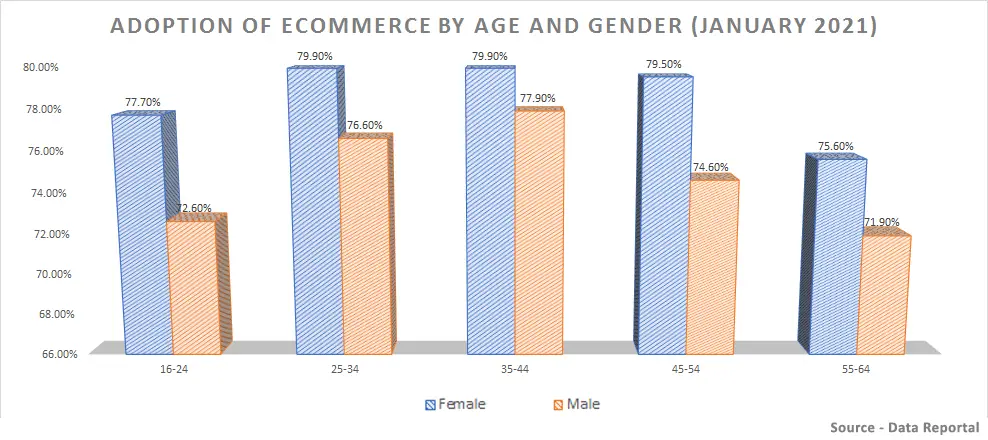
- Women Shop Online More than Men
On a global scale, more than 70% of all internet users use online shopping services. Women are more likely to use eCommerce platforms and buy online than men. As you can see from the chart below, the difference is not huge, but we can still say with certainty that the adoption of eCommerce among women is higher than among men.
The adoption of eCommerce worldwide (both genders and all ages) is 76.8%. In the US, the percentage of internet users who use eCommerce is 80.9%.
Source – Data Reportal
- Mobile Commerce Dominates the eCommerce Market
As discussed in one of the previous chapters, internet users all over the world tend to use phones more often than computers for various online activities, especially for social media. They also tend to use it more for eCommerce. Statista estimates that 72.9% of all e-retail sales will be completed through mobile commerce. Other sources also confirm that at least 70% of smartphone users bought something online over the past 6 months.
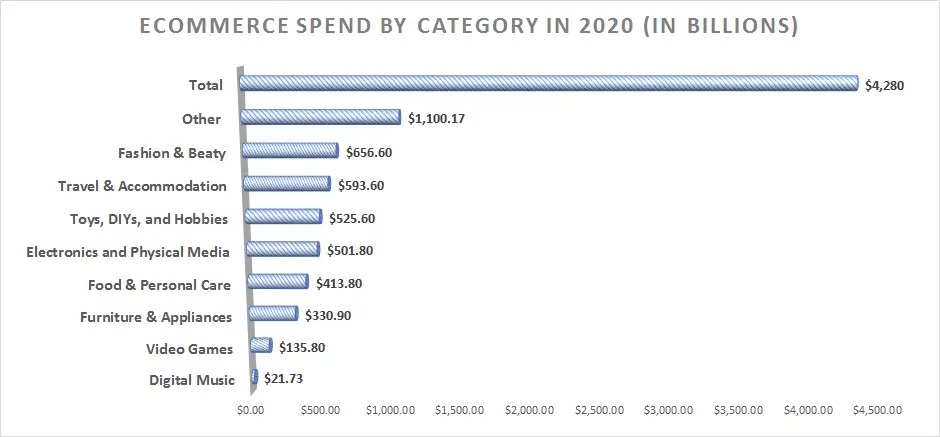
- The Most Popular Online Shopping Categories
According to Data Reportal, most of the money spent online was used to buy fashion-related products and beauty products ($665.6B). Other popular shopping categories were travel and accommodation ($593.6B), electronics ($501.8B), toys/DIYs/hobbies ($525.6B), food and personal care ($413.8B), furniture and appliances ($330.9B), and video games ($135.8B).
Other sources confirm that fashion-related products and electronics are the most popular categories (both globally and in the US).
Sources – Data Reportal, Statista, Oberlo
Online Gaming Stats
Gaming is one of the most popular spare time activities worldwide, but it’s also a huge industry. Games are not enjoyed just by young – they are one of the favorite forms of entertainment across all ages. And they generate a huge profit. Here’re some interesting facts about gaming in 2021.
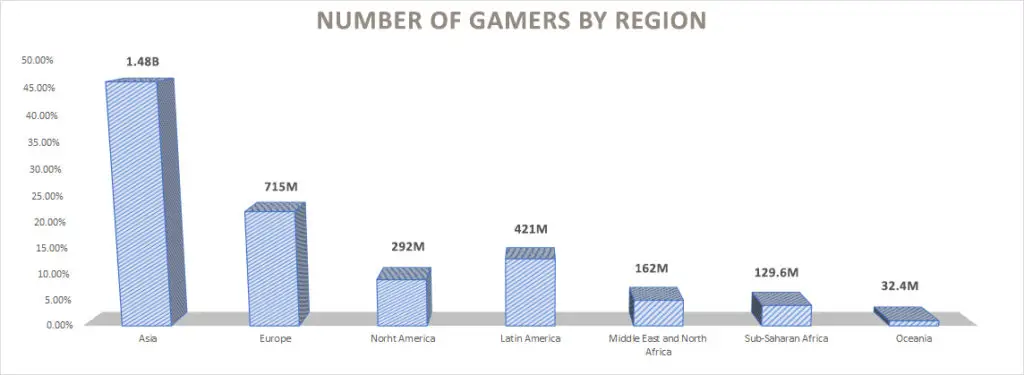
- Game Are Played All Over the World
The total number of gamers worldwide in 2021 was 3.24 billion. That’s 41% of the world population or 62.7% of all internet users in the world. The largest number of gamers was recorded in Asia (1.48 billion) and Europe (715). Below, you can see gamer distribution by region.
Sources – Statista, Finances Online, Cyber Waters
- Gaming is Popular Across all Ages and Genders
Ok, maybe not across all ages equally, but it’s not like you can say that people over 50 or 60 don’t play games. You really can’t – look at the stats from 2020 below. It shows that gaming is a slightly more popular activity among male internet users. The difference is not huge, but it’s noticeable. Also, it’s not a surprise that people over 45 don’t play games as much as people aged 16-44.
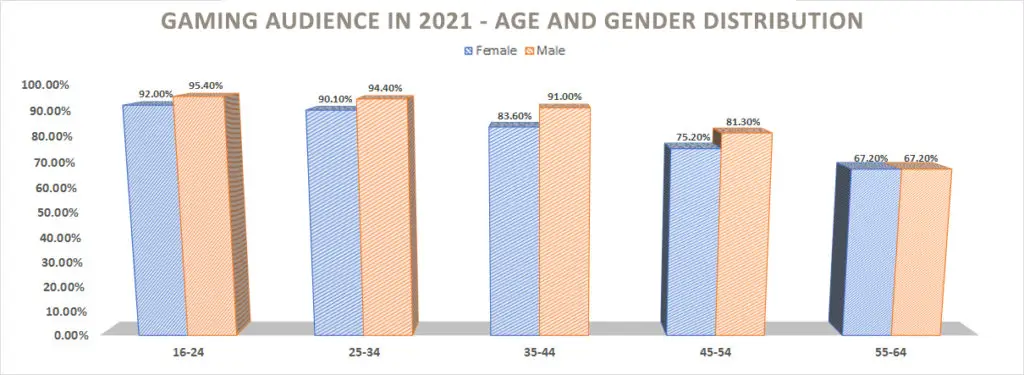
Source – Data Reportal, GWI
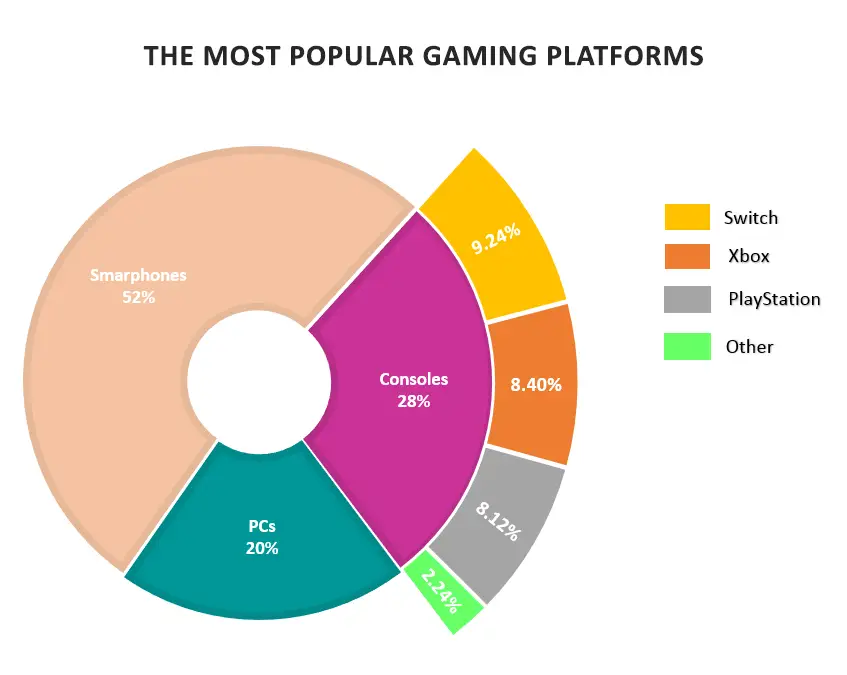
- Games Are Played on All Platforms (But Phones Are the Most Popular)
Phones are used more than computers and tablets for general browsing, social media, and eCommerce. They are also used more for gaming than any other platform. Recent studies show that 52% of all people who play games worldwide use their phones, 28% of gamers play games on consoles, and 20% of people use PCs. The most popular game consoles are Switch (33%), Xbox (30%), and PlayStation (29%).
Source – Cyber Waters
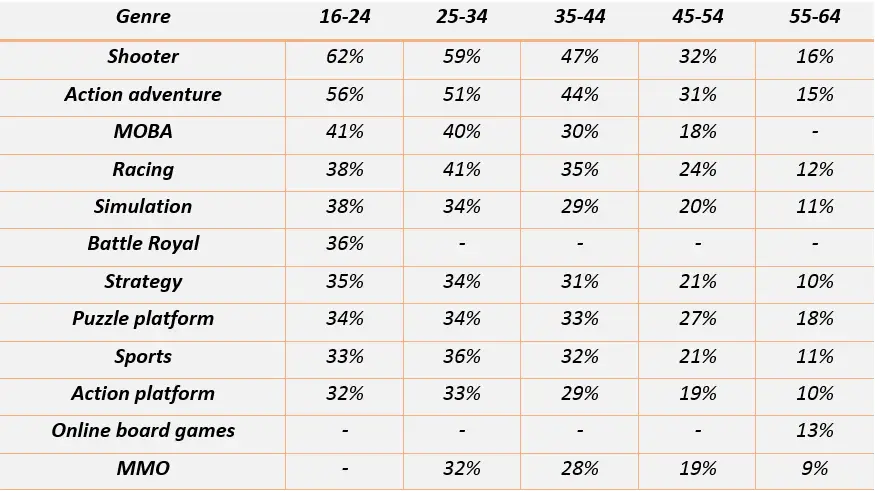
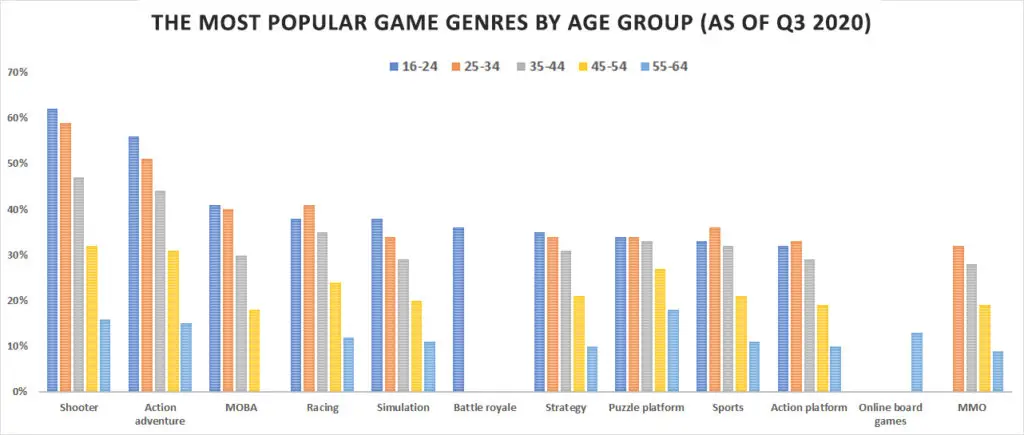
- The Most Popular Video Game Genres
When it comes to popular game genres, the trends haven’t changed over the past two or three years. The most popular game genres across almost all ages are shooter games and action-adventure games.
Sources – Statista, Data Reportal
- Best-Selling and Most Played Steam Games
The list of best-selling, as well as the list of most, played Steam games confirms the claim from the previous stat – shooter games and action games are the most popular among gamers.
The best-selling Steam games in 2021 were Destiny 2, New World, Apex Legends, Rainbow Six SIEGE, NARAKA – BLADEPOINT, DOTA 2, Battlefield 2042, Dead by Daylight, PUBG Battlegrounds, VALHEIM, Counter-Strike, and GTA V.
The most played games in 2021 were Halo Infinite, PUBG Battlegrounds, GTA V, VALHEIM, Cyberpunk 2077, New World, DOTA 2, Counter-Strike, Rust, and Apex Legends. Each game recorded more than 200,000 peak players.
Source – Steam
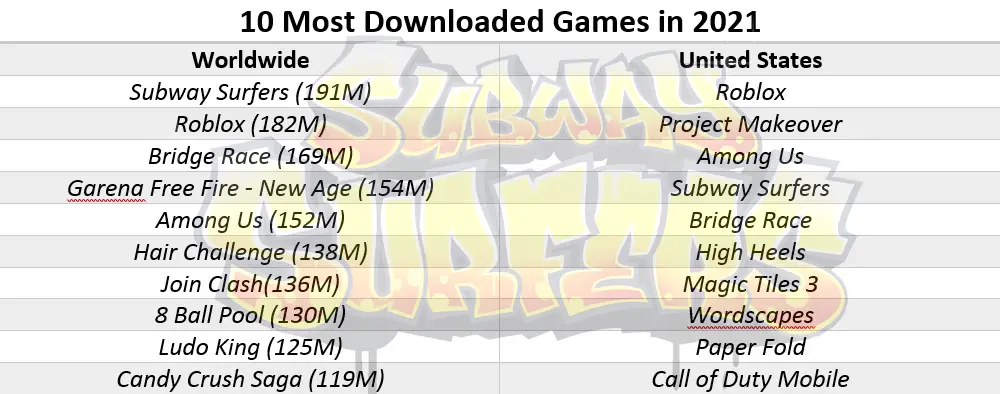
- Top Mobile Games in 2021 (Android and iOS Combined)
According to Apptopia, the most downloaded mobile games worldwide were Subway Surfers with 191 million downloads, Roblox with 182 million downloads, and Bridge Race with 169 million downloads. In the US, the top-three games were Roblox, Project Makeover, and Among Us.
Apptopia report doesn’t include Android metrics from China (only iOS). Android holds 77% market share in this country (much more than iOS), but Google Play is banned in this country.
Below, you can see the full Apptopia’s list of the 10 most downloaded games in 2021 (worldwide and in the US).
- Mobile Games Market Generated $7.4 Billion in December 2021
The global market of mobile games generated $7.4B in just one month. Most of this global revenue was generated in the US ($2.2B). The second and third markets in terms of generated revenue were Japan ($1.5B) and China ($1.17B). The top-three countries have generated 65.6% of the global mobile game revenue in December.
The game that generated the highest revenue worldwide in December 2021 was PUBG Mobile ($244 million). The second highest-earning game was Genshin Impact ($134.3 million).
Source – Sensor Tower
- $89.6 Billion was Generated by the Global Mobile Game Market in 2021
Sensor Tower estimates that the global mobile game market generated $44.6 billion during the second half of 2021 (from July till December 2021). The estimated annual global revenue in 2021 is $89.6 billion. Compared to the previous year ($79.6B), the global revenue increased by 12.6% The estimated European mobile game market generated annual revenue of $11.2 billion in 2021.
Source – Sensor Tower
- Eight Mobile Games Have Surpassed $1B Global Earnings in 2021
According to Sensor Tower, eight games have earned more than $1B in 2021. That’s more than ever before. In 2020, only 5 games surpassed the threshold of $1B.
The biggest earners in 2021 were two games published by the Chinese giant Tencent – PUBG Mobile and Honor of Kings. Each game generated $2.8 billion in 2021. The third was Genshin Impact (published by another Chinese company – miHoYo) with $1.8B. Below, you can see the full list and revenues.
- Value of the Global Gaming Market in 2021
According to VentureBeat and NewZoo, the global gaming market will reach $180.3 billion. Of those $180.3B, the mobile gaming industry will generate 52%. The estimated revenue of the global PC gaming market in 2021 is $36.7B. The gaming consoles market is expected to generate $50.4 billion. The global gaming market is expected to surpass the $200B threshold in 2023.
Sources – VentureBeat, NewZoo
- Cloud Gaming is on the Rise
In 2021, the number of users paying for cloud gaming services reached 23.7 million. It is estimated that the global cloud gaming market will generate $1.6 billion by the end of 2021. The Newzoo projection expects the global cloud gaming market cap to surpass $6.5 billion in 2024.
Source – Newzoo
Conclusion
The internet world is massive and it’s growing rapidly. The influence of the internet and its presence in our lives are enormous. We use it in almost every area of our lives, professional and personal. It became our primary source of entertainment. It allows us to stay in touch with friends and family. It helps us expand our businesses. There’s probably nothing you can think of that internet hasn’t changed.
Learning everything there’s to know from just one article is simply impossible. With our 120 facts and stats about internet use in 2021, we have barely scratched the surface, but we still hope this article answered some of your questions and helped you learn a thing or two.
Stay tuned for more interesting articles about the internet, network equipment, and other related topics.

Hey, I’m Jeremy Clifford. I hold a bachelor’s degree in information systems, and I’m a certified network specialist. I worked for several internet providers in LA, San Francisco, Sacramento, and Seattle over the past 21 years.
I worked as a customer service operator, field technician, network engineer, and network specialist. During my career in networking, I’ve come across numerous modems, gateways, routers, and other networking hardware. I’ve installed network equipment, fixed it, designed and administrated networks, etc.
Networking is my passion, and I’m eager to share everything I know with you. On this website, you can read my modem and router reviews, as well as various how-to guides designed to help you solve your network problems. I want to liberate you from the fear that most users feel when they have to deal with modem and router settings.
My favorite free-time activities are gaming, movie-watching, and cooking. I also enjoy fishing, although I’m not good at it. What I’m good at is annoying David when we are fishing together. Apparently, you’re not supposed to talk or laugh while fishing – it scares the fishes.
Thanks for sharing this! All the best!